Category: Microsoft Excel

  • Dynamic Icons in Microsoft Excel Cell Ranges

    Spice up your interactive Excel Dashboards with dynamically changing Icons, Pictures or Charts

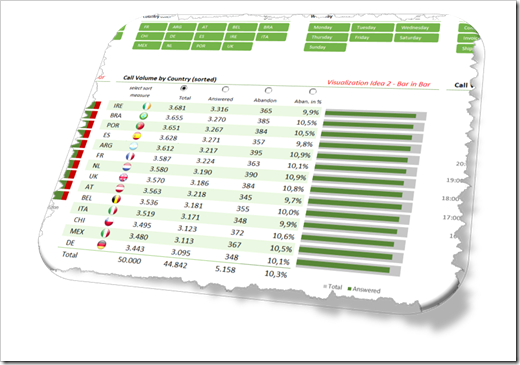
    The Excel workbooks which came with two of my recently published posts showed dynamically changing flag icons inside of a dynamic table on an Excel dashboard.

    Showcase for Table Slicers on Excel Dashboards

    My 2 Cents on the COVID-19 Dashboard by JHU.

    Dynamic Icons Excel Ranges Intro

    The tables visualized data per country and the flag icons next to the country names were automatically adjusted if the user filtered the data, changed the sort criterion or scrolled within the table.

    This week I received some feedback on these workbooks and readers asked, if I could explain this in more detail. No sweat: todays post provides a step-by-step explanation of the technique and the according workbooks for free download.

    (more…)

  • Microsoft Excel Project Calendar Template

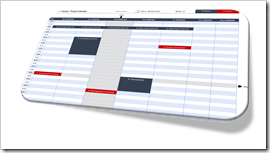
    A ready-to-use Microsoft Excel Template for a dynamic Project Calendar, displaying regular Project Meetings and Deadlines for one selected week 

    Project Calendar Template IntroAs per the subtitle of this blog (see above), Clearly and Simply is about data analysis, modeling, simulation and data visualization.

    If you are a long time reader of this blog (and I am aware there are only a handful), you know that – from time to time – I also post something about Project Management.

    I already published posts here about

    Following this tradition, today’s post provides another little piece out of my Project Management Toolbox: a ready-to-use, dynamic Project Calendar Template in Microsoft Excel. Of course, including the template for free download.

    (more…)

  • Choropleth Maps of Italy in Excel

    A Collection of Choropleth or Filled Maps of Italy in Microsoft Excel

    Map and Flag of ItalyHeads-up: today’s post is dedicated to my friends and readers in Italy. You will certainly only be interested in this article, if you are working in Italy and/or with Italian data.

    If not, you can easily skip today’s post. It does not include any new ideas, it is only new wine in old wineskins: a collection of Choropleth Map techniques (already published here), applied to maps of Italy for different levels of detail.

    ClearlyandSimply is a special interest blog with only very few readers. Most of them are located in the United States, but when I am looking at the web traffic coming from Europe, Italy is always ranked among the top 3, way ahead of e.g. France or Spain.

    I do not exactly know why. I have a hunch, though:

    Back in 2014 and 2015, I helped my friend Marco Nicolucci creating Tableau visualizations of the history of the Serie A (Italian football, or calcio as you say) and the Rugby World Cup for La Gazetta dello Sport. As of today, both visualizations are still available on the Datamania site of La Gazetta:

    If the visualizations should no longer be available on La Gazetta dello Sport, you can also find copies on my Tableau Public Profile.

    So, maybe the publications on La Gazetta dello Sport drove some traffic from Italy my way.

    Also, maybe my Italian internet friend and highly esteemed colleague Roberto Mensa spread the word about my blog. You probably know Roberto. If not, you definitely missed something. Roberto is the guru for data visualization with Microsoft Excel, not only in Italy, but throughout Europe. Together with Krisztina Szabó and Gábor Madács from Hungary, he is running a website called E90E50. I highly recommend to check out the E90E50charts – Excel Charts Gallery, you will find truly amazing work there, all for free download.

    Well, wherever the traffic comes from, this post is for my Italian readers:

    A collection of 6 templates for creating Choropleth Maps of Italy in Microsoft Excel. All of them are ready to use. Simply download the workbook(s) you like, replace the dummies by your own data and you are good to go.

    (more…)
  • Showcase for Table Slicers on Excel Dashboards

    A more practical Showcase for using Table Slicers as interactive Filters on an Excel Dashboard including additional features

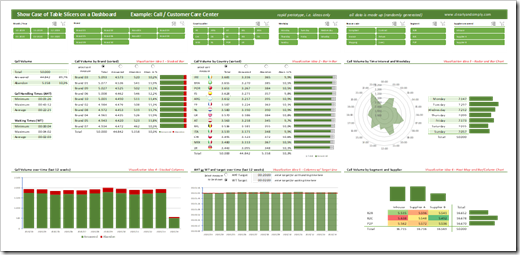
    The recent post Filter Excel Dashboards with Table Slicers was leading with the following screenshot, showing this prototype of a Customer Care Analysis dashboard:

    Showcase Table Slicers on Excel DashboardsFor instructional purposes, however, the article described the how-to on the basis of a way simpler dashboard than that.

    In the past few days I received a couple of messages from my few, but faithful readers, asking if I could publish this more complex dashboard, too.

    No sweat, here it is:

    Download Showcase Slicers on Excel Dashboards (zipped Excel workbook, 5.1MB)

    If you download the workbook, please be informed that

    • all data in this showcase is randomly and mindlessly made up and serves only for the demonstration of the techniques. The distribution of the call volumes e.g. over countries or hours of the day is totally pointless
    • this is a prototype, which I once developed for a potential client to demonstrate possible views and interactive features on a call center dashboard. This is by no means a consistent and story-telling dashboard. It is a collection of ideas. No more, no less.

    That being said, it does include a few interesting techniques. The filtering by table slicers, of course, but also

    • the option to sort table views directly on the dashboard using radio buttons above the column headers (call volume by brand and country)
    • the option to let the user decide which measure and target shall be shown on a chart (Average Handling Time or Waiting Time)
    • dynamically changing flag icons inside the table view “Call Volume by Country”

    Agreed, nothing really new under the sun and you probably have seen most of this already. But still, it may be interesting to see all these features combined with the table slicers.

    And for the records: all this is done without VBA. Just good old Microsoft Excel.

    Stay tuned.

  • Weighted Route Maps in Excel

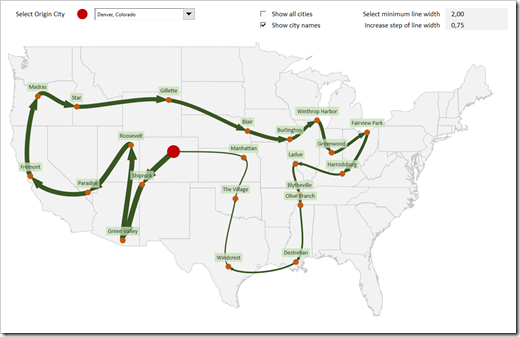
    How to visualize round trips on a Route Map in Excel, including an indication of the quantities transported between the cities

    Weighted Route MapThe recent post series “Geographical Flow Maps in Excel” (part 1, part 2, part 3) described how to visualize flows from one selected city to several target locations, showing the connections between origin and targets and indicating the flow quantity by the thickness of the lines.

    My highly esteemed colleague Joachim Schirra, outstanding SAP and Business Intelligence expert, read the articles and came up with the following question in a comment on LinkedIn:

    “Would it be possible to show a flow with branches, junctions and return flows, too?”

    Although this is a great idea, it sounds easier than it is. Truth be told, I do not have a solution. At least not yet.

    However, Joachim’s comment made me think. What can easily be achieved is the visualization of a weighted Route Map (i.e. a round trip, see image above).

    Today’s post describes how to change and enhance the Geographical Flow Map approach to get to such a Route Map. As always, the post includes the Excel workbook for free download.

    (more…)