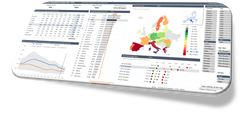
Interactive Excel Dashboard visualizing unemployment rates in the EU. Select a country, filter by age group and gender, and see the selection highlighted across all visuals on the dashboard
1,176 words, ~6 minutes read
 10 years ago, I published a post demonstrating how to highlight one selected item across all charts and views on an interactive Excel Dashboard:
Highlighting on Excel Dashboards
Unlike most of my other publications here, that post actually did make some friends.
And even more, it won a real fan: my good friend and Microsoft Excel MVP Carlos Barboza (Carlos’ LinkedIn Profile, Carlos’ blog: Spilled Graphics) liked this workbook so much that he even included it in some of his presentations, e.g. his great speech on the Global Excel Summit in 2024.
Recently Carlos asked me, if I could provide a version with an updated data source. Of course I can. And while I was at it, I also made a couple of (hopefully helpful) changes.
Today’s article provides this updated version of my European Union Unemployment Rates Dashboard from 2015. It also briefly discusses why interactive dashboards in Excel are still a viable option, even nowadays with Tableau and Power BI.

 If your Excel workbook has many output worksheets, you should provide your users with an option to facilitate the navigation within the model.
 Terms like Artificial Intelligence, Machine Learning, Deep Learning and (Artificial) Neural Networks are all over the place nowadays.