A Set of Choropleth Map Templates for Microsoft Excel
 The dashboard of Lithuania at a glance used a county based map of Lithuania to visualize the geographical distribution of the population by color intensity: the darker the color, the higher the value.
Very often, this type of geographical visualization is called thematic map, heat map or statistical map. The less known, but correct expression however is Choropleth Map.
The idea of how to create Choropleth Maps with Microsoft Excel – as brilliant as it is simple – is the brainchild of Tushar Mehta, Microsoft Excel MVP. I simply “borrowed” his idea and code and put it to effective use on the Lithuanian Dashboard.
Many readers of Clearly and Simply have been interested in this technique, but unfortunately I was not allowed to provide an unlocked workbook of the Lithuanian Census Dashboard (see comments on Lithuania at a glance). That’s why I thought it might be a good idea to write this post including a couple of templates for Choropleth Maps with Microsoft Excel for free download.
The Definition
According to Wikipedia
“a choropleth map (Greek χωρα + πληθαίν:, ("area/region" + "multiply") is a thematic map in which areas are shaded or patterned in proportion to the measurement of the statistical variable being displayed on the map, such as population density or per-capita income.”
The Technique with Microsoft Excel
In his article Conditional Colors of Shapes, Tushar provides a very thorough and clear step-by-step tutorial, including a template with a map of the United States for free download. Thus, I am limiting myself to describe only the basic concept:
- Organize an editable map, i.e. a map where every region is one freeform shape or a group of freeform shapes
- Assign a name to every shape
- Assign a name to the cell range with the data to be visualized for every region
- Create a mapping table, assigning every data cell name to the according freeform shape name
- Create a color range table to define the fill color of a region / shape according to the data value
- Copy Tushar’s code to your workbook and adopt it according to the cell ranges of the mapping table and the color range table in your workbook. With every worksheet_calculate (or any event you may choose), the VBA code loops through the mapping table and assigns the fill color to every region according to the data.
As I said, Tushar’s idea is as brilliant as it is simple.
The Templates for free download
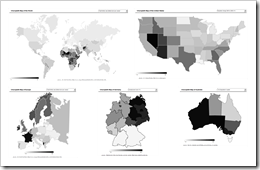
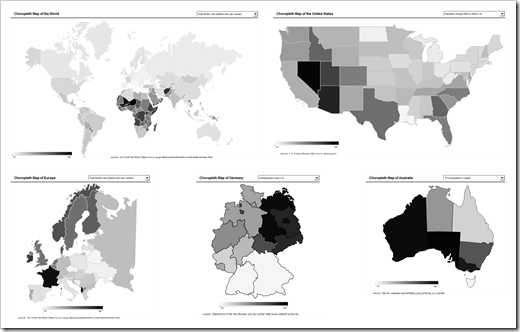
In order to save you some time and effort, I pulled together a couple of common maps and created Choropleth Map templates with Microsoft Excel:
- The World by country
- The United States by state (without Alaska and Hawaii)
- Europe by country
- Germany by state
- Australia by state / territory
For reasons of simplicity I packed all templates into one zipped folder:
Download Choropleth Map Templates (Microsoft Excel 2003, zipped 838.4K)
The templates are Microsoft Excel 97-2003 format, but they should work with Excel 2007 as well.
The disadvantages
Choropleth Maps are a popular visualization of data with a geographical dimension. However, there are a couple a drawbacks coming with this kind of visualization:
- No visualization of development over time
- No information on exact values (unless you are implementing tooltips including the data)
- Very limited direct comparability of the regions
- Possible perception problems with regards to the size of regions (e.g. Rhode Island on a US map)
- Possible misinterpretation because the size of a region may have a greater impact on the user’s visual perception than the intensity of the fill color
- Requirement of real estate on a dashboard
The conclusion
Choropleth Maps are a commonly used and very interesting way of visualizing data with a geographical dimension. They provide a quick overview at a glance of how the data is distributed across the regions.
Due to the disadvantages mentioned above, however, I strongly recommend to carefully consider whether or not a Choropleth Map is the best visualization for your purposes, especially if you are using it on a dashboard with limited real estate. I can’t claim that I am using Choropleth Maps very often. If I do so, I usually implement an additional visualization like a bar chart (see dashboard of Lithuania at a glance).
Last, but not least
Many thanks to Tushar for sharing this brilliant idea, the how-to tutorial and the file for free download.
Update (1) on
Thursday, July 25, 2013
I recently
received an email from my reader Dave who found and fixed quite a few errors in
the World Map:
- Removed
Iceland from Denmark - Removed
Greenland from Canada and made it a part of Denmark - Sweden
had two parts, one of which was actually part of Denmark. Removed it from
Sweden and added it to Denmark - Removed
the eastern half of Terra del Fuego from Great Britain and added it to
Argentina - Added
Northern Ireland to Great Britain - Added
French Guyana to France
I updated
the workbook for download now (see download link above).
Many thanks
go to Dave for being so attentive and for providing the corrected map.
Update (2) on
Thursday, July 25, 2013
This week I
received another email from Daniel asking for a World Map with a color scale
other than grey shades. I took a palette of color schemes from a later
Choropleth Map post and built it into the World Map template. I thought some of
you might also be interested:

Leave a Reply