Category: Microsoft Excel

  • Software Project Dashboards – Episode 2

    How to create a Microsoft Excel dashboard to monitor the progress of a software development project (part 2 of 3)
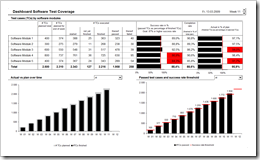
    Dashboard Software Test Progress - click to enlarge This is the second part of a 3 post series on software development project dashboards with Microsoft Excel. Episode 1 of the series discussed a dashboard to monitor the software defect statistics. Today’s article addresses to another very relevant facet in a software development project: The progress and success of testing.

    Testing as the process of validating and verifying quality and suitability of the developed system is at least as important as the number of defects detected. Actually, it goes without saying that testing is the prerequisite of finding software defects. Having said this, it probably would have been better to start the series with this part, but I recognized this too late. My bad.

    Anyway: Today’s post provides a minimalist dashboard to monitor test progress and test success within a software development project. As always including the Microsoft Excel workbook for free download.
    (more…)

  • Software Project Dashboards – Episode 1

    How to create Microsoft Excel dashboards to monitor the progress of a software development project (part 1 of 3)

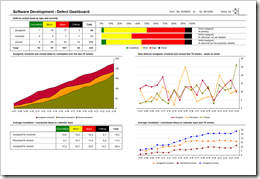
    Software Development Defect Dashboard - click to enlarge When it comes to manage software development projects, you have to monitor a lot of different quantitative and qualitative metrics in order to  answer the main question:

    “Where are we?”

    As in any other project you have to take care of the usual suspects in project controlling like the completion rate of tasks, the milestones and quality gates, the budget adherence, etc. In software development projects, however, there are a couple of very important specific additional facets to be monitored closely:

    1. The actual status and the trend of software defects
    2. The test progress, test coverage and test success
    3. The actual status and the development of change requests

    Today’s article is the first of a 3 post series on how to create minimalist, dynamic software project dashboards with Microsoft Excel; this time a software defect monitor dashboard including the Microsoft Excel workbook for free download.
    (more…)

  • Bluffing a Visual Cross-tab with Excel

    How to create a Tableau lookalike cross-tab chart with Microsoft Excel

    Matt Grams, author of Bullet Graphs for Excel: A Simple Way? is kind enough to contribute another guest post here on Clearly and Simply, this time discussing how to create cross-tab charts with Microsoft Excel.

    Cross-tab Chart - click to enlargeTrellis charts. Panel charts. Visual cross-tabs. Cross-tabs. Variations of small multiples. Whatever you want to call these charts, one thing seems clear to me: Tableau offers aesthetically restrained yet beautiful implementations.

    So how about constructing a visual cross-tab with similar aesthetics in Excel? Today’s post describes the how-to, including an Excel workbook with detailed explanations for free download.

    (more…)

  • Bullet Graphs for Excel: A Simple Way?

    A guest post by Matt Grams discussing an alternative solution of creating bullet graphs with Microsoft Excel

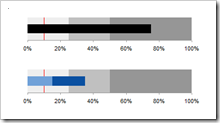
    Bullet Graphs - click to enlargePreamble:

    We proudly present the first guest post here on  Clearly and Simply: Matt Grams describes a very interesting alternative approach of creating bullet graphs in Microsoft Excel without using VBA.

    When you need one or more horizontal bullet graphs in an Excel spreadsheet, what do you do if…

    1. you work exclusively in Excel 2003 or earlier, 
    2. you don’t want to use a 3rd party add-in,
    3. you want your spreadsheet to be free of VBA, and
    4. your bullet graph must have a professional appearance?

    Faced with this scenario of apparently limited options, you’re sure to come across Charley Kyd’s tutorial at ExcelUser. Attempting to build a bullet graph with this method was a useful exercise for me, but the approach left me flustered at the complexity of the data arrangement and chart set-up. If making just one bullet graph was that hard, what are you going to do when you have multiple bullet graphs to implement? Furthermore, not having the bullet graph data values in a single row was far from ideal.

    This post describes an alternative and simpler approach of how to create bullet graphs with Microsoft Excel, including step-by-step tutorials and an example workbook for free download.

    (more…)

  • Build your own Choropleth Maps with Excel

    Amendment #6 to Choropleth Maps with Excel: a workaround to transfer the names of regions from a svg file into xls

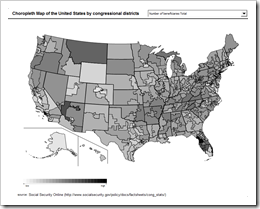
    Choropleth Map USA by Congressional Districts - click to enlarge

    In a comment on Multicolored Choropleth Maps with Excel Dave Hammer pointed to a couple of excellent maps on Wikimedia Commons in svg file format (scalable vector format). Dave wanted to use these maps to create choropleth maps with Microsoft Excel, but he hit a roadblock with regards to the texts (names of counties or districts) associated to the shapes in the svg file: after ungrouping the map in Excel, the shapes were available, but the associated names were gone. In his example (counties or congressional districts), it would be a lot of laborious work to assign the names to the shapes manually. And it would be error-prone as well.

    Actually there is a workaround to let Excel do most of the work. This post describes this workaround and provides a template of a choropleth map of the United States by congressional districts for free download.

    (more…)