Amendment #6 to Choropleth Maps with Excel: a workaround to transfer the names of regions from a svg file into xls
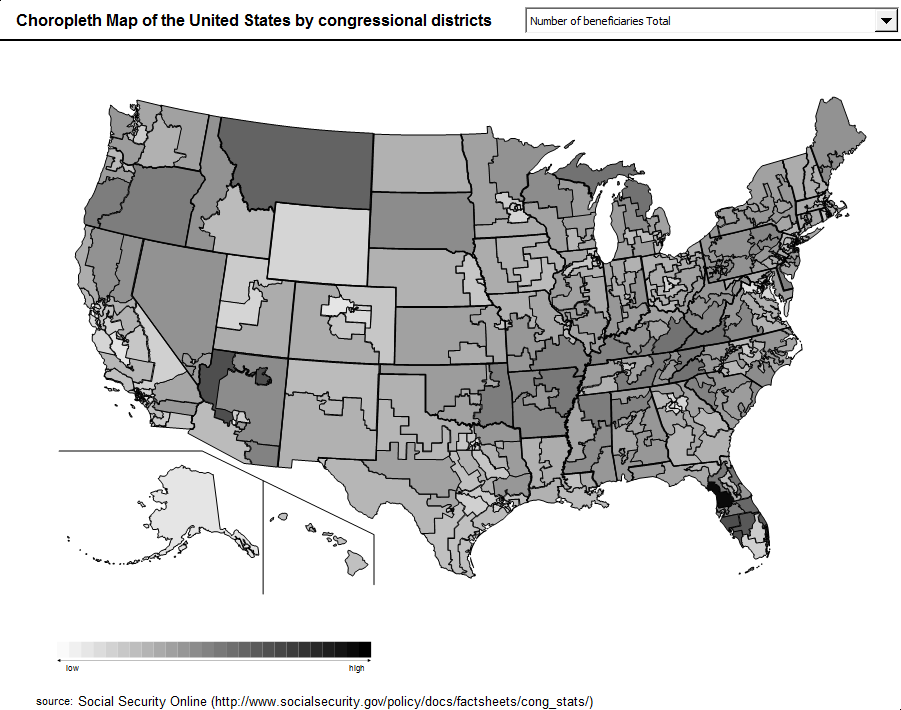
In a comment on Multicolored Choropleth Maps with Excel Dave Hammer pointed to a couple of excellent maps on Wikimedia Commons in svg file format (scalable vector format). Dave wanted to use these maps to create choropleth maps with Microsoft Excel, but he hit a roadblock with regards to the texts (names of counties or districts) associated to the shapes in the svg file: after ungrouping the map in Excel, the shapes were available, but the associated names were gone. In his example (counties or congressional districts), it would be a lot of laborious work to assign the names to the shapes manually. And it would be error-prone as well.
Actually there is a workaround to let Excel do most of the work. This post describes this workaround and provides a template of a choropleth map of the United States by congressional districts for free download.
Here is the step by step tutorial of how to convert loyalty free svg files into Microsoft Excel and build your own choropleth map template:
Step 1: Download your map in svg format
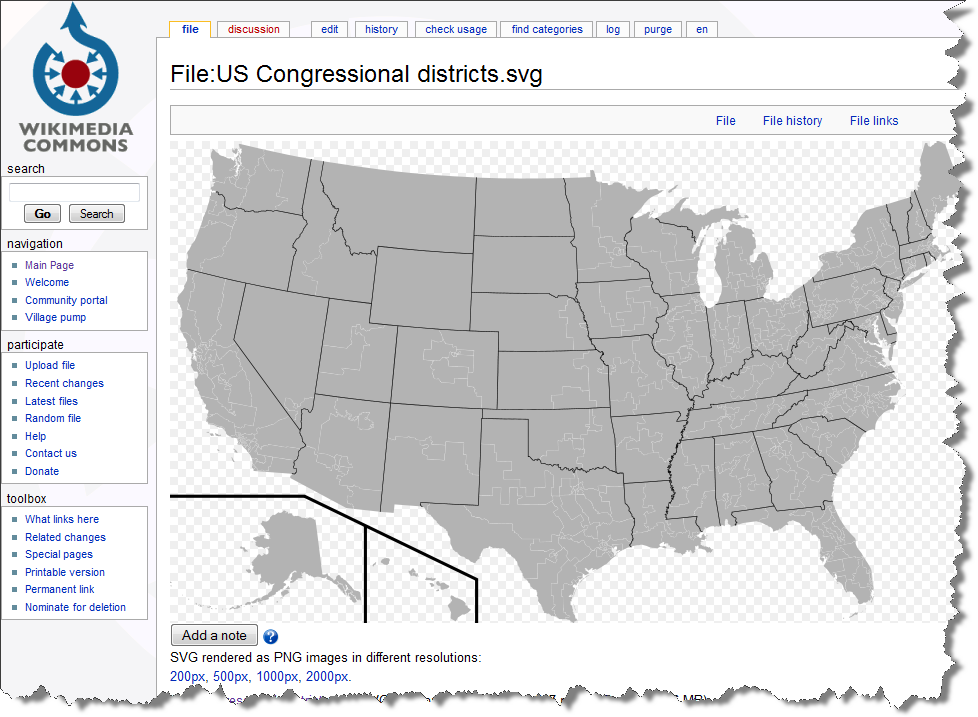
Download the map you need. As Dave pointed, a very good source for scalable vector graphic maps is Wikimedia Commons. A search string like “file: US congressional districts” will take you to a map like this one including a link for free download:
Step 2: Convert the map to Enhanced Meta File format
Open the svg file with a vector graphic editor like Inkscape (open source). Click on “File” and “Save as” and choose Enhanced Meta File (emf) as the file format.
Step 3: Insert the enhanced meta file into Microsoft Excel
Open Microsoft Excel, insert the Enhanced Meta File and ungroup the object to freeform shapes. You may have to repeat the ungrouping until you have one freeform for each region. The result will look like this:
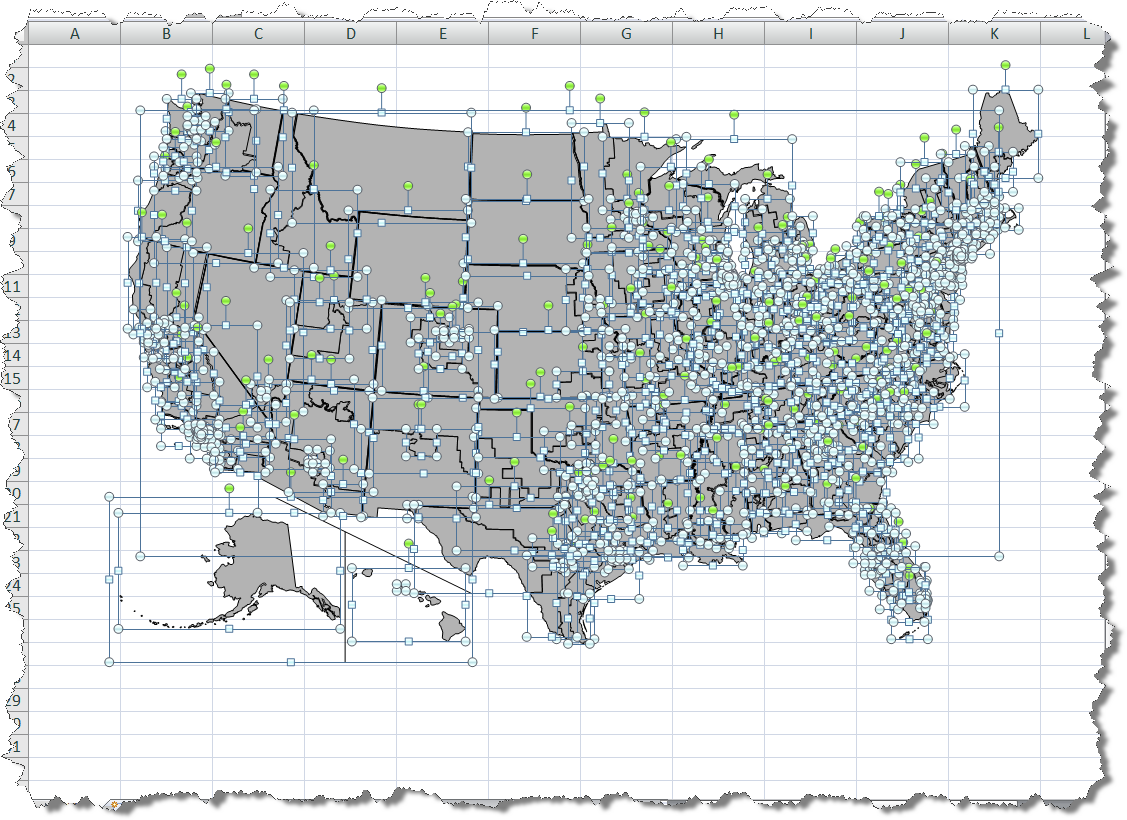
Well, we have the shapes in Excel now, but – as mentioned above – the names of the districts that have been assigned to the shapes in the svg file are gone. Excel automatically assigned new names to the shapes like “Freeform 1”, “Freeform 2”, etc. If we want to create a choropleth map, we would have to select a freeform, go to the name box and type in the correct name. And we would have to repeat this for each and every district. This would be a lot of laborious work for 436 districts. Here is an easier way of doing this:
Step 4: Open the svg file in Microsoft Excel
Open a new workbook with Microsoft Excel and browse for the svg file. That’s right. You can directly open a svg file in Microsoft Excel. The svg file format is nothing else than xml based (see further explanations here). And you can open xml files in Microsoft Excel as well. After you opened the file, you will see a worksheet like this (this example is Excel 2007):
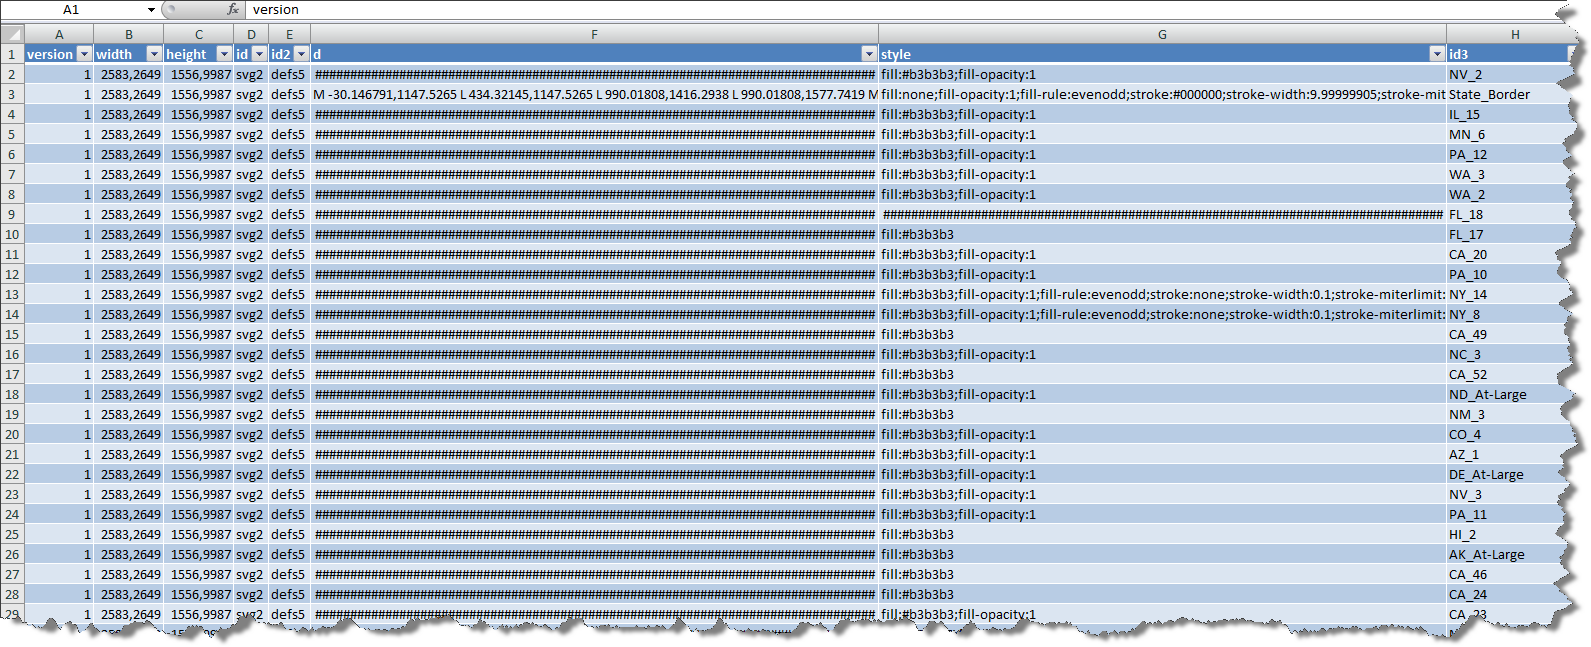
A lot of data, but the only column we are interested in is column H. In this example, the header of this column is called “id3”. This column contains all shape names. Copy the data of this column and paste it somewhere into your workbook created in step 3, let’s say in column N.
Step 5: Clean up the list of district names
Now we have to clean up the district names so that they are applicable as freeform names in Microsoft Excel. Select the range with the names and replace characters that are not valid for names in Excel by an underscore. You can simply do this using search and replace (ctrl H).
Step 6: The trick
The trick of this workaround is the fact that when importing the enhanced metafile into Excel and ungrouping it, you lose all the data connected to the shapes, but the order of the shapes is the same as it is in the svg file. All we have to do now is to rename the shapes using two small VBA procedures. Open the VBE (ALT F11) and copy the following VBA code to your workbook:
Option Explicit

Sub GetShapeNames()
Dim shp As Shape
Dim i As Long

 i = 1
 For Each shp In ActiveSheet.Shapes
 ActiveSheet.Range("M1").Offset(i, 0).Value = _
 ActiveSheet.Shapes(i).Name
 i = i + 1
 Next shp

End Sub

Sub SetShapeNames()
Dim shp As Shape
Dim i As Long

 i = 1
 For Each shp In ActiveSheet.Shapes
 ActiveSheet.Shapes(i).Name = _
 ActiveSheet.Range("N1").Offset(i, 0).Value
 i = i + 1
 Next shp

End Sub
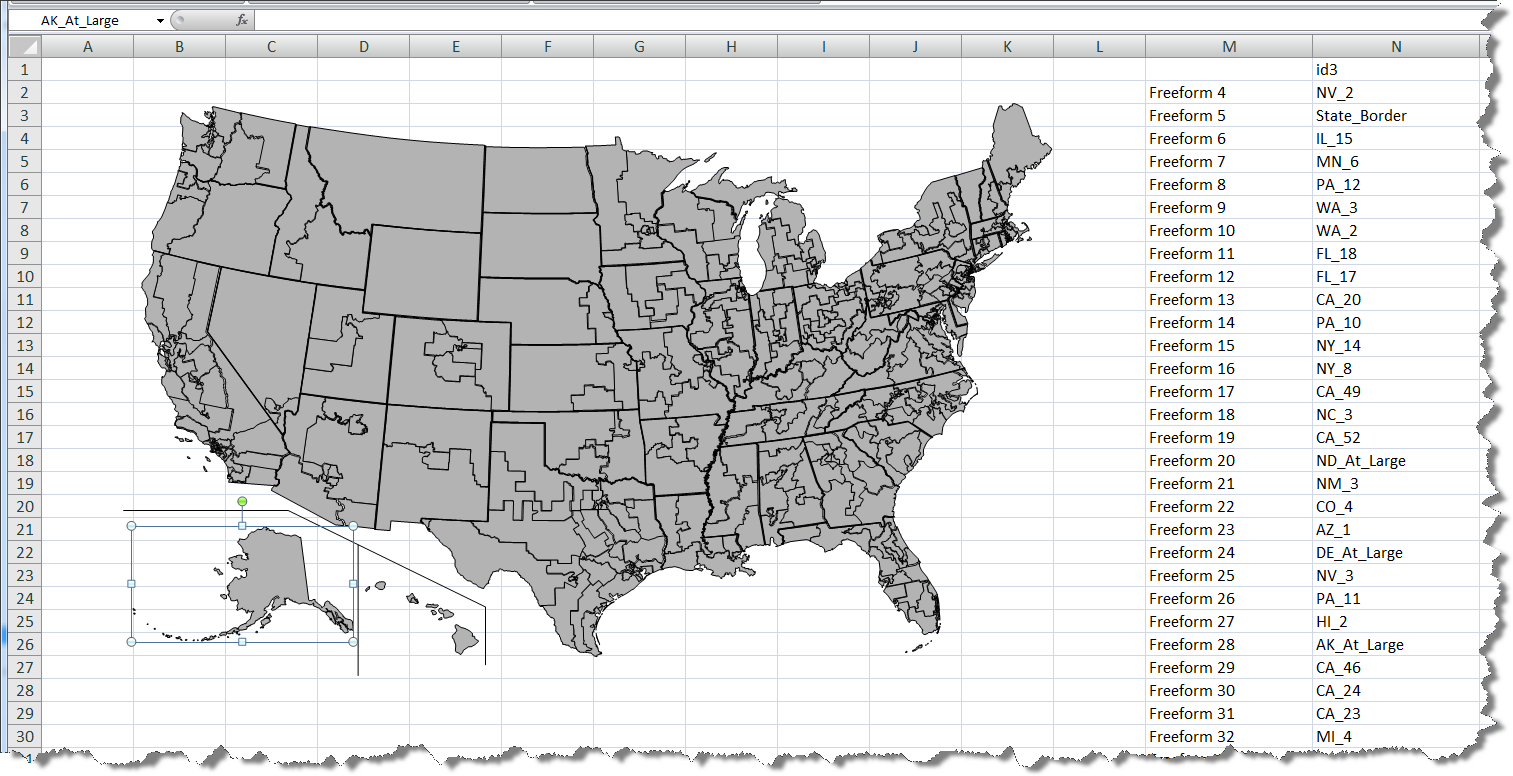
Run the macro “GetShapeNames” first to retrieve all freeform shape names Excel assigned to the shapes and write it to column M of your workbook. Do some spot checks to make sure that Excel's freeform shape names in column M correspond correctly to the names of the districts in column N. Call “SetShapeNames” afterwards to rename all shapes with the shape names of column N, i.e. the names of the districts.
Your workbook will look like this now:
The VBA procedures are one off solutions and you can delete them afterwards.
Step 7: Create the choropleth map
I guess I do not have to explain this in detail, so here are the main steps in a nutshell:
- Download any given choropleth map template here on Clearly and Simply
- Open the workbook and delete the existing map
- Insert the map we created in the previous steps by copy and paste
- Delete the data (sheet "data") and insert as many new rows as you need for your map
- Delete all existing data names (“D_XX”)
- Insert the data
- Expand the cell range of the range name “MapNameToShape” on the sheet “Control”
- Insert the list with the shape names we created in step 6 into column D
- Create a list of range names in column C, e.g. using a formula like ="D_"&D63
- Copy the list of created range names and paste it into column H of the sheet “data”
- Select the range G5:H440 and click on Insert, Names, Create and click on “from right column”
- Delete column H
The result
That’s it. Here is a screenshot of the result:
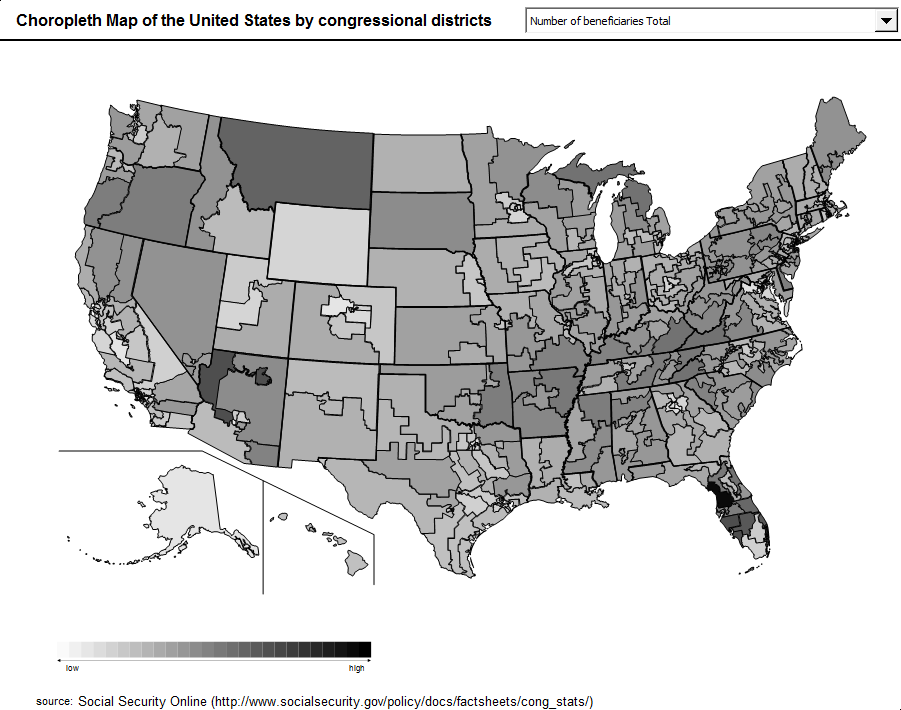
And here is the link to the workbook for free download:
Download Choropleth Map USA by Congressional Districts (Microsoft Excel 2003, zipped 377.3K)
I think with this how-to tutorial, the maps available on Wikimedia Commons and the existing templates here on Clearly and Simply, you should be able to create your own choropleth map templates with Microsoft Excel according to your requirements.
Nevertheless I am planning to write one more post on choropleth maps. For those of you waiting for new ideas: I promise it will be the last one on this topic. It will not be about choropleth maps with Microsoft Excel, though. The next post will discuss choropleth maps with Tableau Software.
As promised, in September we will be back with new ideas and examples of dashboards and visualizations here on Clearly and Simply.
Stay tuned.
Last but not least
Many thanks to Dave for the heads-up, his question and the inspiration to write this post.
Update on August 30, 2009:
I just found another very interesting source for loyalty free maps: D-Maps offers a variety of almost 4,900 maps in different file formats. This might come in handy if you do not find what you are looking for on Wikimedia Commons.
Comments
116 responses to “Build your own Choropleth Maps with Excel”
Robert,
Thanks so much for taking the time to figure this out. A very elegant solution!
Dave
hey guys, I’ve a question…I import vector maps from Inkscape to excel (directly via copy-paste), I then ungroup everything and finally get a set of freeform shapes – countries.
some freeform-countries consist of several separate regions (ex. New Zealand, 2 islands but one freeform object…it is not a grouped object, it is one freeform)
question: how can I split these shapes in excel (ex. I want to have two freeforms for New Zealand)
Of course I can do it in Inkscape and then import to excel, but I’d want to know whether it is possible directly in excel.
Thanks
Dmitry,
thanks for your comment and question. I am not sure that I understand this correctly. I just checked an example with two objects grouped in Inkscape and saved as emf. If I import this emf into Excel, I am able to ungroup them.
From my point of view there is no such thing as a freeform shape consisting of two different objects. Either it’s one freeform (e.g. connected by an invisible line) or it’s a group of freeform shapes and you can ungroup them in Excel. Or am I missing something?
Can you elaborate a little bit on your problem or send your example (email-link on the left)?
Thanks.
The svg -> emf -> insert into Excel -> Ungroup process does not seem to work for Excel 2007. The error message is “This is an imported picture, not a group …”
How is it possible to get an editable map into Excel ?
Simon,
thanks for your comment.
It is not a version issue with Excel 2007.
Actually the full message you are receiving after you try to ungroup the object is this:
“This is an imported picture, not a group. Do you want to convert it to a Microsoft Office drawing object?”
If you answer this question by clicking on “Yes”, the EMF object will be converted and ungrouped.
Fantastic tutorial…
Robert
Thanks for putting this together, it is exactly what I need. However, I cannot get it to work at all. I think it may be something to do with using a mac? The only way I can get emf into excel is through copy and paste, this then means I cannot ungroup it. I cannot get an svg in at all. I am hoping that there is some sneaky setting that you can tell me I need to change to get this all working?
Thanks again
Julian
Julian,
thanks for your message. I have to tell you that I do not know much about Excel on Mac and I do not have a Mac available.
However, maybe it has nothing to do with the Mac version. You can’t ungroup EMF files after inserting them by copy and paste from your image editor. Not only on the Mac, same in the Windows version. You have to save the EMF to your computer and insert it into Excel using Insert and Picture. You will then be able to ungroup the object as described above.
Excel will display a warning:
“This is an imported picture, not a group. Do you want to convert it to a Microsoft Office drawing object?”
If you confirm by clicking Yes, the EMF object will be ungrouped and you will have the shapes available for the next steps.
I hope this will be helpful.
Robert,
Many thanks for quick reply and help (and article!). Sadly it did not work, but I will keep plugging away it to see if I can get it to work.
Julian
Julian,
how about this: you send me your emf file, I import it in my Windows Excel, send it back to you and you test if this will work on your Mac? You will find the email link at the top of the blog.
Robert,
Thank you for this tutorial. My end goal is to automate the map creation through vba entirely so I can batch create these maps from mapinfo, the GIS software I use.
However, I am having a slight problem. After I import the EMF file to excel, when I ungroup I am experiencing two bugs.
1. If the EMF is particularly small, when I ungroup the image, the points of each shape seem to shift and create a shape with only right angles, losing all of the nice curved borders from the map. The ‘fix’ I have found is enlarging the image first before ungrouping, and then it seems to work fine. But, since I am automating, I am wondering if there is a different fix for this that I do not have to do manually.
2. At random times, when I ungroup some of the shapes will rotate slightly (maybe 30-60 degrees). I can hit undo and retry, and sometimes it works the second time, but for automating, this could become problematic.
Thank you in advance for your help. This tutorial is awesome!
-Mason
My apologies, the first comment had a typo for the email adress. This comment has the correct email attached to it. Thanks.
Mason,
thanks for your comment. Interesting project. Since I do not have mapinfo available and do not know the details of your VBA code, I doubt I can be helpful with your problems.
Just one idea on your first problem: maybe you could check the size of the imported EMF file before ungrouping it using the .Width and .Height property of the Shape object. If the size of the EMF is smaller than a predefined minimum value, you can increase the size by VBA. Not sure if this will solve the problem, but it could be well worth a try.
With regards to your second problem: I noticed very small distortions of the shapes when (manually) ungrouping the EMF file in some cases, but not to the extent of 30 or 60 degrees. It will be tough to find a solution for this unless you can identify the root cause, i.e. what are the characteristics of the EMF file causing this error. I think you can only automate the process if you exactly know in which cases it occurs and why.
Hello Robert,
excellent tutorial ! Got it !
Many thanks,
Jan
Hello Robert,
thank you for this fantastic blog and for providing all these extremely useful visualization tools!
I have built a map of North Rhine-Westphalia following this article and the other one about using Indiemapper to transform shape files into SVG. Everything worked fine until step 7: Create the chloropleth map. How do I delete an existing map from an example template and insert my newly created map? Do I have to select every single shape to delete or copy it? I’m sure there must be another way?
Thank you
Rolf
Rolf,
thank you for your comment and your kind words.
You do not have to delete the existing shapes one by one. You can select all and delete them in one go (home tab, find&select, select objects, which is Start, Suchen und Auswählen, Objekte markieren if you have a German installation of Excel). Same applies to copying your own shapes into one of my template workbooks. You have to adjust the shape names and the mapping tables afterwards, of course.
Hello Robert,
thank you for your immediate response!
It looks like this option is not available in Excel 2003 but fortunately Excel 2010 is installed on another computer here and it works!
Thank you
Rolf
Rolf,
the same option is also available in Excel 2003. You have to make the drawing toolbar visible (view, toolbars, drawing) and click on the little icon with the arrow. Anyway, I am glad to hear it works for you now using Excel 2010. Let me know if you have any further questions.
Dear Robert,
Many thanks for this great blog, i have downloaded afghanistan map in svg and converted to emf and un grouped it in excel which works fine but problem is that i’m unable to replace the name of districts as you mentioned in step:5. If you need the file i will send it to you. Thanks again
Javed,
sure, send me the file by email (“email me” link see at the top or in the left column of the blog) and I will have a look.
Thanks Robert for your kindly getting back, I have sent you the file please kindly have a look.
Thanks again.
Dear Robert,
thanks for all your time and interesting ideas. I’ve made some -very simple- excel maps usng the tutorial found at http://www.excelcharts.com/blog/how-to-create-thematic-map-excel/
and now i would like to get it nicer and more robust using your tutorials. But I often have a problem importing the emf into M Office picture: many shapes are cut in pieces by a straight line, and even if I try to regroup them, you’ll still see the cutting line in the final map. Did anything similar ever happen to you? Could it be due to the fact that I export the emf from gis (ESRI) software?
Thanks in advance for your help (I’ll send you the emf if you want/have time to check)
Livia
Livia,
thanks for your comment. I received your email and will have a look at your workbook later today.
Thank you Robert, in the meanwhile, I’ve used your latest suggestion (indiemapper)to import shp and export svg, and it worked fine! You saved me a lot of time, thank you so much.
My conclusion is that my problem originated from yet another bug of esri softwares…
Livia
Robert, thank you for great tutorial. I have a small problem with macro (run-time error 1004: Method Range of object_Global failed) – CheckColor Range(myCell.Value), “MapNameToShape”, “MapValueToColor”
Can you pls help me to fix it?
Daniel,
I suspect the names “MapNameToShape” and/or “MapValueToColor” are missing or different in your workbook. Double check the named ranges and adjust the names or the reference to the names in the VBA code. Let me know if this does not solve the issue.
Just a hint for those having difficulty with the ungrouping of the EMF file in Excel. I had the same problem with weird shapes, but it solved itself when I ….
unchecked “Convert Text to Paths” when saving the file as EMF in Inkscape.
Hi Robert, I have everything inputted with no errors, but I cannot get the map to update with the appropriate shading when you alternate through the selection fields on the map page. It just remains blank
Any suggestions?
Thanks
Chris
Chris,
hard to say without seeing your workbook and map. Send me your workbook by email and I will have a look (email link see on the left or at the top of the blog).
Hi Robert
Your work is really amazing, thank you for putting this together for US but the only issue i have is the same as Daniels when i add a new location with new image and data and add in a D_** value i get a error on the macro saying CheckColor Range(myCell.Value), “MapNameToShape”, “MapValueToColor”
What would be the best way to correct this issue?
Regards
Nick,
if you add a shape / country to the map, you have to conduct the following steps:
1. Add the shape to the map
2. Give the shape a name, let’s say S_XYZ
3. Add the data row to the sheet data
4. Give the new data cell (new row and the “Selection” column on sheet data) a name, let’s say D_XYZ
5. Add the new data cell name D_XYZ and the name of the new shape S_XYZ to the Name-to-Shape lookup table on sheet control
6. Go to the Name Manager and expand the definition of the name MapNameToShape to cover the entire lookup table, i.e. also the new assignment we added in step 5
Hey,
Yeah i realised it about 30 seconds after posting, thanks for all your help and love your work.
Nick
Hi Robert,
Thanks so much for this tutorial – extremely useful in public health research.
I had one question about exporting graphs to image files for use in PowerPoint/Word documents. Is there a simple way to export the graph, or better to take as screen shot and insert the image into the document?
Thanks,
Peter
Peter,
sure, no problem. You have different options:
1. Take a screenshot with an external screenshot utility like e.g. the Windows snipping tool
2. Select the range where the map is and click on Copy|Copy as Picture on the Home tab
3. Click on Find&Select|Select Objects on the Home tab, select all map objects, copy them and paste them into the other application. With this technique, the shapes will still be editable in PowerPoint
Those are the manual options. If you want to automate the process using VBA, have a look at this post, for instance:
Export Microsoft Excel Dashboards to PowerPoint
Brilliant!
Thanks so much for the help.
Peter
First off thanks for the time and effort you put into this site, It’s valuable to my research and helps me skip quite a few steps setting up systems.
I’m having a challenge using Excel 2010/Windows 7 and I’m stuck on step 3.
Downloaded this file: http://commons.wikimedia.org/wiki/File:TexasPanhandle.svg
Installed inkscape and converted to emf along with opening the emf in Excel. Then once I try to open the .svg file with Excel to clean up the names i get a warning “The file (filename) is in a different format than specified by the file extension.”
I click through this warning and am given three options – “How would you like to open this file – 1. as an XML table, 2. as a read-only workbook, 3. Use the XML source pane.” None of the options open the svg file and I can’t figure it out???
…grrrr!
appreciate your help
Joel,
I can reproduce the issue using the map you linked to. I can open the file using an XML editor, but when opening it with Excel, I receive an XML parser error. I can’t tell you why, probably some definitions or statements in the SVG file which Excel can’t handle.
Apparently, you are looking for a map of Texas by county.
Two suggestions:
Option 1:
I found an alternative SVG file of Texas by county, which can be opened with Excel:
Texas by County
Option 2:
We had a couple of other posts here on Clearly and Simply providing Choropleth Maps of the US by counties, e.g. the post prior to this one or the one with the improved algorithm here:
Faster Choropleth Maps with Microsoft Excel
You could simply download the workbook, delete all other states and adjust the data and the control worksheet. I assume this would be way faster and less work than creating it from scratch.
Helpful and quick response. 🙂
Hi Robert, this is great stuff here.
I am trying to replicate your format to create a chloropleth map for ICES fishing areas. Using your instructions and recommended programs I’ve gone shp -> svg -> emf and now into excel. In my excel file the map seems to be very small in size but with a long lag time. The more significant problem is that the colours on my map are not changing. If you could have a gander that would be greatly appreciated.
Here is a link to the svg file:
https://www.dropbox.com/s/nktne2ppvt10gkl/icesareas.svg
The emf file:
https://www.dropbox.com/s/p6pcah2yuauoj3v/icesareas.emf
And the excel workbook:
https://www.dropbox.com/s/rx5mzvx5isrrsgd/ICES%20chloropleth%20attempt.xlsm
Many thanks for your contributions to the excel community!
Griffin
Griffin,
I just downloaded your workbook and will have a look at it now. I will reply by email as soon as I figured out what the problem is.
Robert,
Granted, you have a joyful life and plenty of hobbies outside of this forum 🙂 I have one more question. Your shortcut suggestion of using the national map and “cutting the fluff” is very helpful. When I do this though, the counties don’t align tightly when I scale the map. Instead of pieces of a puzzle I get some overlap and gap. For instance. I cut everything aside from TX. group the TX counties, lock the aspect ratio, but somehow I get gaps between counties. This does not happen using the same technique on the TX map you recommended above. I think it might be that the level of detail at a tighter zoom may not have been there to begin with? Thoughts? Either way, I am ahead of where I began and appreciate this site.
Joel,
I just tried my own suggestion (no. 2) and unfortunately, I have to agree with you: the map isn’t 100% exact and there are some distortions when deleting all other states and resizing Texas.
Root cause are the inaccuracies you get from converting SVG to EMF and from ungrouping the EMF file. This somehow distorts the shapes and the more you zoom in, the more visible this is.
Truth be told, it is a workaround and it all depends on the quality of the map. US by county looks great in total, but I have to admit my suggestion of only using the Texas part of it wasn’t a good advice. So, I get back to my suggestion no. 1. You have to go the extra mile and create it with a more detailed SVG file from scratch. I am sorry, but I do not see a better option…
Hi Robert,
This a really great job, I’ve worked on your samples to improve them a little bit (choose the number of degrees for the scale and choose the two main colours).
Now I face a new problem, I want to have two maps for which I can’t find a good svg template.
The first would be the world map by continents and the second would be the France by region (and not by departments).
Do you know a way (maybe with code?) to group (dynamicly or not) several shapes in order to colour them with the same colours? I’m thinking about a new column next to the abbreviation column with the abreviation of the continent (or region for france map).
Thanks for sharing your ideas and your thoughts.
Alex
Alex,
d-maps.com provides a map of France by regions in different formats:
http://d-maps.com/pays.php?num_pay=240&lang=en
Wikimedia Commons has a map of the World by continents only, i.e. without state borders in SVG format:
http://commons.wikimedia.org/wiki/File:Europe_location_blue.svg
You can group shapes manually in Excel (select the shapes and click on Group on the Format Tab) or you can group shapes using VBA with the Group method of the ShapeRange collection.
Thanks for your help. I don’t like so much d-maps, I prefer the world map you use in your template. I’ve found a good one for France and did the work.
For the world map I’ll try the method you suggested.
By the way are you interested in my maps?
Alex,
what is wrong with d-maps? They provide tons of different maps for free and most of them are already in WMF or EMF, so you can directly use them in Excel without having to transfer them as described above.
Anyway, sure, I am interested in seeing your maps.
Robert
Thank you very much for your tutorial and this clever piece of work.
I managed to import my map to Excel 2007 and successfully ungrouped the shapes (about 1,400). I can see that each of the shapes has a Freeform number
Unfortunately, the svg file did not contain any columns with unique identifiers for the shapes. I do, however have a file with a list of identifiers (S_01006230,…) which I hope may be in the same order.
I copied this list to Excel but cannot get the macro to match these to the Freeform shapes. The macro appears to run but with no result.
Have you any suggestions?
Regards
Robert
Robert,
hard to say without seeing the workbook(s) / data. If you can send me your workbook and list of names by email, I will have a look at it and provide my 2 cents. You’ll find “Email Me” links at the top or in the left column of the blog.
Dear Robert
Thanks very much for this useful tutorial !!
I’m struggling though…I hope it will work out :).
Maybe you can help me, I’m stuck in step 4. I export a map from arcgis with the extention .svg. I open excel 2010 -> open the svg file as an xml data file and under the column “id3”, I only have two different names and they don’t seems to be the shapenames. It seems there is a problem on the export from arcgis to .svg. Any idea on how to work around this problem?
Many thanks for your kind support,
Jasmina
ps: I send you an email with the files
Jasmina,
it depends on the SVG file you are using, i.e. the names of the regions will not always be in column id3. In your case, the names are in column ns1:tspan (column AG after you opened the SVG with Excel). I will send you the workbook by email in a minute.
Please be advised that sometimes the SVG file does not contain the names at all. As I said, it depends on the SVG file you are using.
Having said that: in your case with only 12 regions on the map, you would probably be faster if you rename the freeform shapes in Excel manually. The tutorial above was meant for a map with a couple of hundreds or even thousands of regions like the USA by county.
Hi Robert,
Many thanks for your quick reply. Now that step 4 is solved, I’m stuck in step 5. I run the macro to get the shape name but it doesn’t work. I sent you an email with the excel file, maybe I’m missing a step.
I know for this country there are not may regions and I could do it manually but the idea is to make this choropleth for a number of countries and some of them have a lot of admin levels and it will be time consuming and also can make mistakes doing it manually. It would be great to do it the way you describe, if possible.
Thanks again,
Jasmina
Jasmina,
you have to ungroup the shapes first and delete any freeforms except for the regions, e.g. the labels and the frame around the shapes before you run the macro (see step 3 above). I will send you the workbook in a minute.
Robert,
When using d-maps and downloading in WMF format, is there a corresponding metadata file containing the names for the shapes? For instance, I downloaded Michigan counties as WMF and had no problem importing and ungrouping it. However, I am not sure how to proceed with reassigning my names from FreeForm1..n to the actual county names.
Thanks for any guidance!
Marc
Marc,
I am sorry, I do not know a way to access the metadata / county names from a WMF file. This does not mean it is impossible, it is just above my head.
I can think of the following 3 options:
1. Assign the shape names manually. A lot of work for 83 counties, but you have to do this only once.
2. D-Maps offers also SVG files for download and I tried, but those files do not contain the names of the counties. With a quick research on Wikimedia Commons I found a map of Michigan by counties in SVG file format which includes the county names:
Map of Michigan
3. Final option would be to download the map USA by counties provided in the article
Faster Choropleth Maps with Excel
and delete everything except Michigan. I guess, this would be the easiest and fastest way.
Hi I am on step 7 and I can’t seem to make the map work, can you help me with that.
Nancy,
can you provide a few more details? What exactly is the problem?
hi
I have a bug in this yntax. can you please look into this.
CheckColor Range(myCell.Value), “MapNameToShape”, “MapValueToColor”
Simant,
either one of the named ranges is missing or misspelled or a range or shape name is missing or misspelled in the lookup table “MapNameToShape”. Hard to tell without seeing the workbook. If you want to, you can send it to me by email and I will have a look.
I seem to be unable to open the svg file into excel. It says there is a parsing error and the extension is nog recognised.
Is there a way around this?
Michael,
I double checked with the SVG file mentioned in the article and it is still working for me. There is a warning message when opening the file saying the file format and extension would not match, but if you confirm opening the file with clicking on “Yes”, everything works just fine.
However, it always depends on the SVG file you are using. I cannot guarantee the techniques works with every SVG file and even if it generally works, there is no guarantee the file really includes the names of the regions.
Hi,
Thank you for the great tutorial. However, I have a little problem with the ungrouping part. I read in previous comment that a previous user had a similiar problem. After the “This is an imported picture, not a group. Do you want to convert it to a Microsoft Office drawing object?” I click “Yes”. Unfortunately, nothing appears to happen. The EMF object is not converted or ungrouped.
Do you have any suggestion on how I could resolve this issue?
Many Thanks.
Duncan,
ungrouping the imported object only converts the EMF into Microsoft Office shapes. The shapes are still grouped then, so you have to repeat the ungrouping until you get to the regions of the map, You also possibly have to delete anything else than the regions, like frames around the map, legends, etc. (depending on what is on the EMF map).
If this does not solve your problem, you can send me your EMF by e-mail and I will have a look (e-mail link see the top and the left side of the blog).
I used the site of D-maps to download my SVG files.
Apparantly they don’t work while I indeed could open yours. Ill see if I can get others from elsewhere.
Thanks for checking for me 🙂
Hi,
very interesting. I want to use it in my class.
I have a problem with opening .emf file in Excel 2010. When I try to open the file, program opens text import wizard says that data are divided.
I do not know where the problem could be.
Thank you
Petr,
don’t open the .EMF file with Excel. Insert it as a picture (Insert | Pictures).
This works much better. Thank you.
Hi. Great tutorial. I am having difficulty with the “ungrouping” step. When I run the getshapenames code, excel detects some grouped objects and reports the grouped objects back in a single row. It appears that some items in the .emf map are not “ungroupping.” I have clicked around on the map looking for ungrouped items, but I have yet to find any. Thanks for any assistance. Using Excel 2013 if that helps (or hurts).
Evan,
it actually always depends on the structure of the EMF file. You have to ungroup until there aren’t any groups left. Very often, you have to delete some shapes which are not representing a region you want to color.
Hard to say what the problem is with your map. You can send me your workbook by email and I will have a look.
Hi Robert, I sent it to the email indicated in the link at the top of the page. Any help would be appreciated. Happy new year!
Evan,
I received your email and will send you an answer in a few minutes. Your problem is easy to solve.
What was the problem here? I’m having the same issue and have been trying to troubleshoot but can’t figure out what’s going on. Everything else seems to be in order, so I’m not sure why the shading is not updating…
Greg,
I can’t tell you what the specific problem was in Chris’ workbook. As far as I remember he never sent the file, so I assume he figured it out on his own.
If the code isn’t working correctly, there are a few things which may be wrong. Very often the names of the shapes and the defined names on the worksheet do not match (because of e.g. a typo, an additional trailing blank or a missing name, etc.).
Another common root cause is an incorrect definition of the named ranges (e.g. it does not cover the full range).
As I said above: hard to tell without seeing the workbook. If you want, you can send me your workbook per email or post it somewhere for download.
Robert I love this, I would consider myself an intermediate excel user, but I would like to develop a choropleth map of North American I can input sales & purchases data into. I have 65 ‘data points – states, provinces etc.’ and 125 freeform shapes. I tried to rename the shapes but ran into difficulties in that after running the macros above they moving around on me, so I thought I would use the freeform shapes as is in the Auto-shape input on the ‘control’ tab and then simply correspond the name to the right data. I am currently putting in all the named ranges and noticed the file is bugging out. If you wouldn’t mind could you take a quick peak and see if there is an easy fix or if I am missing something.
Roger,
sure, send me your workbook by email (email me link at the top of the blog) and I will have a look.
Hi, I’ve created a map of an English county with 7 Districts within it using MapInfo GIS. I’ve saved the map as a .emf file and imported it into excel. I’ve managed to ‘ungroup’ the image into freeform shapes, but it doesn’t look as though the shapes correspond to the District boundaries – ie there are not 7 freeform shapes in the image. Also I’m having difficulty with the step – ‘select freeform, go to name box, type in correct name’ – how do I do this in excel – right click on each freeform? As there are only 7 distinct Districts, I would be happy to rename each individual freeform.
Jonathan,
if you do not have 7 shapes after ungrouping, you can manually group the parts of the regions to 7 groups. If you then rename the grouped objects, the technique described above will still work.
Regarding the renaming process: you select an object (freeform or group of freeform shapes) and either type the name into the name box (top left of the sheet, right above the header of column A and left to the formula bar) or go to the Selection Pane (ALT-F10), select the object there by clicking, click again and change the name.
Hi Robert,
thanks for this, I’ve tried to manually group parts of the regions to 7 groups but have found that some regions share the same boundary, and there do not appear to be enough freeform shapes generated when the .emf file is imported into excel. For instance, I managed to manually group objects for 1 District boundary, but when I came to group objects for the second district boundary, I found there was 1 vital bit of the boundary missing which belonged to the first boundary. Perhaps I’m missing the following – ‘you may have to repeat the ungrouping until you get 1 freeform for each region’.
Jonathan,
the technique does not work with all EMF files. If the ungrouping does not result in one shape per region, you have to find or create another map.
You may either try to find another EMF file or a SVG file and transfer it into EMF using a vector graphic editor like Inkscape.
Or you try to find an ESRI shape file, convert it into an SVG file using Indiemapper and convert the SVG to EMF using e.g. Inkscape.
Finally you could try to find the polygon data of the regions and use the tool provided here
Create Excel Freeform Shapes from Polygons
to convert the polygons to freeform shapes.
Hi Robert, thanks for this, I’ve managed to create an SVG using the export function in ArcView GIS, and converted this file in Inkscape to EMF format. This has produced better results when imported into excel, but for 3 Districts large in area the freeform shapes cover the boundaries but leave a gap in the inside of the District. I can see why – the boundary line tends to fluctuate – but I would need to use your tool to create excel freeform shapes from Polygons for these 3 Districts, providing I can extract the background mapping data (In MapInfo) into excel.
However I’m having problems getting the map to change colours using the drop-down selection box. I’ve checked that the syntax matches for the shape names, data names in the table, and in the named range ‘MapNametoShape’. Would there need to be any changes in the VBA code?
Jonathan,
changes in the code aren’t necessary. There seems to be an issue in the set-up of the workbook (names or named ranges). If you want to, you could send me your workbook by email and I will have a look.
Hey Robert,
Very good tutorial thanks a lot I have been searching ages for something like that.
My problem is though that i have a .svg file with approximately 1400 fields but some of them are connected so 3 fields have the same ID for instance. In total it makes around 670 IDs. One of my problems is now that when ungrouping it does split into 1400 Freeforms. And my other problem is that one group somehow gets lost. It does show up in the excel selection pane but it somehow doesnt show up on the map and instead there is a white area there. I have already tried making it visible and invisible again but with neither of those options it does show up on the map.
(note: it is there when i initially insert the .emf file and after the first ungroup it is still there but after the second it isnt)
Any ideas or help would be very much appreciated as I cant really figure a solution for both of my problems
Thanks
Deniz
(The map is of Australian postal codes in Victoria so it has quite a lot of freeforms and i thought that would be the problem but when i reduced it to just Melbourne, which has significantly less it didnt work either and the same 100 postal areas disappeared when ungrouping)
Deniz,
truth be told, the entire workaround of SVG- and EMF-files and ungrouping them in Excel does not work in all cases. It always depends on the SVG-file you are using and in the past I had a couple of SVG-files which didn’t work with the technique described above.
I can’t tell you what the problem is in your case and I can’t even guarantee it will work with your file at all.
If you want to, you can send me your workbook by email and I will have a look and try to help. No promises, though.
Wonderful work u have done here, thanks so much.
i have challenges at step 7,
can u be more elaborate on the process
1) of linking the data to the shape
2) what column represents mapname
3) how do i link the codes
thanks
Femi,
1. Each data cell on the data worksheet has a name (in the workbook posted for download: e.g. “D_AK_At_Large” in cell Q5). These names are linked to the shape names in the assignment table called “MapNameToShape” on worksheet control.
2. If you are referring to the names of the shapes: they are defined in the second column of the named range “MapNameToShape” on worksheet control.
3. I am sorry, but I do not understand what you mean by “link the codes”.
Thanks for the prompt reply.
if it is not too much to ask, can you send me a video on how u were able to achieve step 1-7, i think it will be easier to follow up the steps as i see you do it.
Thanks
Femi,
I am sorry, no. I do not have the time to produce videos. I suggest you download the example workbook and have a look at the sheets and especially at the named ranges. It isn’t too complex and I am sure you will be able to figure out how the model works.
ok thanks
can you be more detailed on step 7, because i guess thats where i lost it.
step 1-6 was more detailed, but step 7 wasnt
i have my polygons, the data, but dont fully understand the controls and the integration to the polygon
i didnt understand from the step downwards
Expand the cell range of the range name “MapNameToShape” on the sheet “Control”
Insert the list with the shape names we created in step 6 into column D
Create a list of range names in column C, e.g. using a formula like =”D_”&D63
Copy the list of created range names and paste it into column H of the sheet “data”
Select the range G5:H440 and click on Insert, Names, Create and click on “from right column”
Delete column H
Femi,
if you are stuck at the point where you have to expand the cell range of MapNameToShape: this point assumes that you have more or less regions (i.e. shapes) than the map in the template I provided for download. To adjust the reference of the name, you have to go to the Name Manager in Excel and change the range MapNameToShape refers to.
Regarding all following activities: I am sorry, but I do not see how I could possibly get more detailed.
Maybe you can be more specific about what exactly you do not understand.
Also, I do not understand why you are talking about polygons in your previous comment. The approach does not use polygons…
hi robert
i am sorry to bug you,
i have all the controls,data and map linked as it is in the template, but the challenge is when i select the metrics the colour of my map doesnt change, what do i do?
Thanks
Femi,
it could have various reasons if your map doesn’t update. I suggest you send me your workbook by email and I will have a look.
ok rob,
really appreciate your prompt responses
i will sent it on monday.
Thanks.
Hi Rob,
Please find the map i developed at this link:
https://drive.google.com/file/d/0B26RyCxoExtWSEYwRXJxZ1lxZUk/view?usp=sharing
Hope to hear from you soon.
Femi,
go to worksheet control, select range B71:B112, copy the selection and insert it as values (Paste|Paste Special|Values). Next time you select another measure with the drop down, the map will update.
thanks rob,
i tried it bt didnt get the desired result, guess i didnt paste in the right location, please where do i paste it?
Femi,
exactly at the same position (B71:B112). Just replace the formulas by the values.
thanks rob, so grateful,
2 more questions though:
how do i label my map
how do i change the color scale from grey/black.
Thanks
Femi,
if “label” means a legend, please have a look at this article with an improved template (using a better algorithm and a legend):
Faster Choropleth Maps with Microsoft Excel
The template also includes a set of different color scales you can choose from.
If “label” means that you want to have the values displayed on the map: you cannot add a text to freeform shapes. Texts in shapes are only possible in standard Excel shapes like rectangles, circles etc. The only way to add text to the map would be to insert additional textboxes, assign the name of the region and the data value to the text of the textbox and position the textbox in the middle of the shape. You would also need some extra code to update the values of the textboxes when you update the map, of course. Having said that, I would strongly recommend against this idea. Adding textboxes to all shapes will definitely clutter the display and cause more confusion than insight. I would rather work with a data table or a bar chart next to the map or provide tooltips.
thanks rob for your suggestions they are well taken
as regards the labels, i just need to display the name of the polygon, so that users can easily relate with the map.
Thanks so much for your prompt responses, finally i have my map
This look great and that for I, also thank you. I was looking for something like that fro long time. Power Map in Excell had something similar but now it is awailable only in cloud office.
Still, because my maps have different row number comparing to templates, I have the problem you adressed in a comment before:
”if you are stuck at the point where you have to expand the cell range of MapNameToShape: this point assumes that you have more or less regions (i.e. shapes) than the map in the template I provided for download. To adjust the reference of the name, you have to go to the Name Manager in Excel and change the range MapNameToShape refers to.”
I have no clue where is this ”Name Manager”.
Could you help / direct me, please ?
Thank you very much !
Marius,
go to the tab FORMULAS on the Ribbon and click on the icon Name Manager in the section Defined Names of this tab. Or simply use the keyboard shortcut: press CTRL and F3.
Thank you Robert.
Looks like I have to change names of Shapes (romanian diacritics seems not to be Ok).
Mean time I wrotte an eMail to you too.
If you got some time to have a look at it …
Regards from Romania
Hello Robert,
Thank you for the tutorial! I’ve made it to the end of step 7, and cannot get my map to read new colors. I’m sure I’ve made a mess of the spreadsheet and definitely need help. I’m not sure whether you’re still watching the thread – but if so, please help me move forward. The error code I’m having is in the VBE at this line in UpdateMap():
CheckColor Range(myCell.Value), “MapNameToShape”, “MapValueToColor”
Thank you for any help!
Will,
there is probably an issue with the defined names of the shapes (a typo in a shape name or a missing shape name, etc.). Send me your workbook by email and I will have a look.
thanks so much,
Its very usefully for me.
But , I still Have a question for you.
Could We type in name box ( in example in Q5 name box is D_AK_At_Large) so automatically ?
If we have many shapes it will so tired when type one by one in name Box.
Thanks so much
Widya,
there is a simpler way: create the names in the cell range right to the cells with the data by concatenating “D_” and the name of the regions. You can then use the Excel feature “Create from Selection” in the “Defined Names” section of the Formula tab to assign these texts as names to the cell range where the data is. Afterwards you can delete the formulas.
hi, did you get this created ok for New Zealand? I also want to create a this with a map of NZ.
Craig,
I never tried a map of New Zealand, but I do not see why the tutorial shouldn’t work for New Zealand. It always depends on the EMF- or SVG-file you are using, though.
If it doesn’t work with your SVG-file, you could also try to find ESRI shape files and transform them as described here:
Create Excel Choropleth Maps from Shape Files
Hi Robert
Thanks for this useful article. I have a map of the UK split up into regions and all of my required data in Excel, however I’m having some issues at steps 6&7. I’m not the best on Excel and I’m not quite sure what I need to do next. Would you be able to take a quick look (if I share my work) and advise me of what to do next?
Thanks, Dan
Dan,
sure, send me your workbook by email (see email me link at the top of the blog) and I will see if I can help.
Hello Robert, brilliant tutorial, concept most of us would have never thought of!
However 1 issue is lack of free SVG maps already complete with individual shape names for CITY/COUNTY
Specifically can’t find decent SVG for UK ( UNITED KINGDOM / GREAT BRITAIN / ENGLAND), those I have found don’t have name column ID3 on opening SVG in XL, and/or after converted SVG > EMF then inserted into XL, those available didn’t UNGROUP coherently, if they’d ungroup at all.
Hence the quesiton, source of free & complete UK SVG?
Currently I’m looking for a map to emulate to categorising of UK POLICE AUTHORITIES, as seen in this dataset:
https://www.ons.gov.uk/peoplepopulationandcommunity/crimeandjustice/datasets/recordedcrimedataatcommunitysafetypartnershiplocalauthoritylevel
Stephan,
I agree, finding a map including the names can be difficult. I do not know a site or data source reliably providing SVG files including the names. I am sorry.
That being said, I did a quick search on Wikimedia Commons and found this map:
UK Map by Statistical Regions
The SVG file seems to have most of the county names in column id5. As far as I can see, some of the names are missing, but this map could be a starting point and you could manually add the missing names after you imported the EMF file into Excel. I am not sure the structure of this map fits to the data source you linked to, though.
Robert, u are d bomb!
Keep it up!
😁😁😁😀
Hi Robert, I have been a religious follower of your blog and really observed your goods works especially being an authority in Choropleth Maps of which are very few in the world. I can even count them with my fingers.
Please, Robert I am trying to create a Choropleth Map of Nigeria as part of my classwork.
The Task:
It has to do with the individual States in a Country map, say USA, applicable in an electioneering process. That is when a party wins a state, the color assigned to that party reflects on the individual map of that state.
That’s, it will be dynamic, as results comes in, the color on such maps fluctuates.
I will be grateful if you can give me an helping hand here.
Thanks.
Lest I forget, d-maps.com site rocks!
George
George,
I just sent you an email with a map of Nigeria.
I cannot more express the great work that Jon Peltier, Stephen Bullen and many other MVPs and not MVPs did to alleviate the understanding what is the driving forces behind Excel graphs. The new developments are very exciting. Sometimes finding my own solutions using best practices, sometimes finding something through my own efforts. Some aspects not deeply defined now. I was never convinced that excel mapping satisfy the needs of users. I worked with pixels and active x controls finding astonishing insight. Working with the concepts of Stephen Bullen since 1996 and others later. My sincere thanks to all of you.