How to use Table Slicers and Timelines as interactive Filter Controls on a Microsoft Excel Dashboard
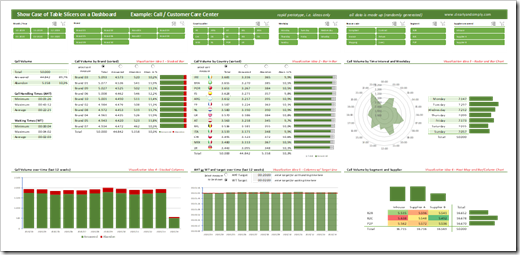
Filter Excel Dashboards with Table Slicers
and
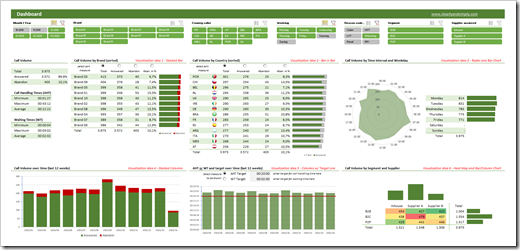
Showcase for Table Slicers on Excel Dashboards
described a technique how to use Excel’s popular Slicers on tables as easy-to-use, interactive filter controls on a dashboard.
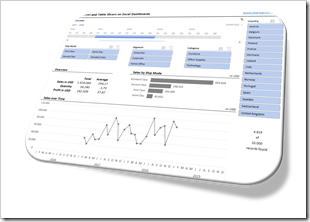
Although the approach can quickly be implemented and is working fine, it has one major shortcoming: for whatever reason, timelines are only available for Pivot Tables, not for tables. If you have a date dimension in your data (and according to my experiences many data sets do), you can’t let the user filter by dates with a timeline on a table.
Today’s article will describe a work-around to eliminate this shortcoming. As always, the post provides the example workbook for free download.


