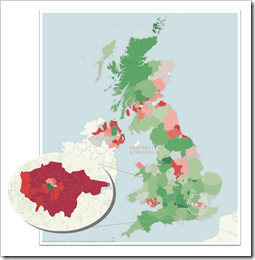
A step-by-step guide to Richard Leeke’s TabGeoHack for creating your own filled maps in Tableau Software
 Way back in 2009, we had a beautiful guest post by Giedre Aleknonyte describing a workaround to generate Choropleth Maps with Tableau (using version 5.0 by the way).
Those days are over. One of the major new features of Tableau 7 is Filled Maps (or Choropleth Maps as we used to call them in all blog posts here).
Did I say those days are over? Well, not quite. While Tableau provides filled maps down to the zip code areas in the United States, the level of detail in other countries is more or less rudimentary. In Germany, for example, you can create filled maps only for the 16 states (Bundesländer). This is nowhere near sufficient to do really compelling geographical data analysis and visualization. Up to now there was no way to do anything about it.
My friend Richard Leeke recently developed a fantastic tool called TabGeoHack which allows you to import literally any geographic level of detail of any region in the world into Tableau in order to use them for visualizations using filled maps. Richard is a co-founder of Equinox Ltd, a New Zealand based IT consulting firm and if you are a long time reader of this blog, you certainly already know him from the fantastic guest post series on Site Catchment Analysis. Even if you haven’t seen those articles, you probably know him from the Tableau Forum.
Surprisingly enough, Richard made his tool generously available for free in this Tableau Viz Talk post.
Please be aware that TabGeoHack – as its name suggests – is a totally unsupported hack utility, using an open back door of Tableau. The tool is a workaround with a certainly limited lifetime. It is beyond question that Tableau will provide similar built-in functionality with one of its next versions.
Richard was kind enough to grant me a sneak preview of TabGeoHack before publishing. Although the download includes a very detailed description and instruction manual, it took me quite a while to cut my teeth on the use of TabGeoHack. That’s why I thought it would be a good idea to write a step-by-step article on how to use TabGeoHack, including an example on Tableau Public, visualizing unemployment rates in Germany, broken down by counties, on a Filled Map.
So, do you want to create your own filled map of e.g. English counties, Spanish municipalities or even the individual sales regions of your company?
Here you go.
(more…)
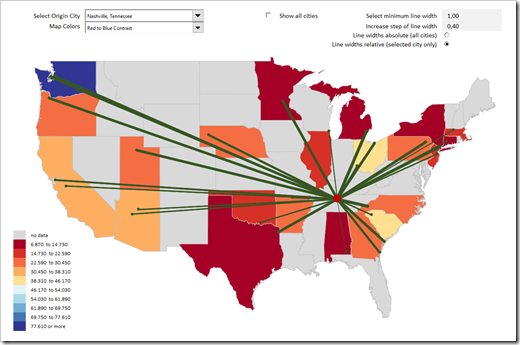
 This is the third and final part of our series on how to create a Geographical Flow Map in Microsoft Excel and it will be a relatively short article (at least by my standards).
 Way back in 2009, we had a beautiful guest post by Giedre Aleknonyte describing a workaround to generate