Author: Robert

  • Excel Oddity using Named Formulas in Charts

    With Named Formulas as the Data Source of a Chart Series, Excel does not always plot the values correctly

    959 words, ~5 minutes read

    Forgotten Bug by Peter Pryharski on UnsplashUpdate on Monday, August 3, 2020: The described issue is solved, thanks to Andy Pope. Please refer to the update at the end of the article or to Andy’s message in the comment section. Many thanks, Andy.

    The recent articles Dynamic Storyboards in Excel and A practical Example for Dynamic Storyboards described a way how to plot several data series in one XY Scatter Chart by offsetting the data points.

    During the implementation of the workbooks coming with these articles, I stumbled across a weird Excel oddity:

    If you are trying to transfer the offset calculations into Named Formulas and use these Named Formulas as the source of you chart series, Excel does not always plot the data correctly.

    Please be advised that today’s post is only a description of the issue. I have no clue why this is happening and therefore I do not have an explanation of what is going on, let alone a solution.

    I have a question for you, though: have you ever encountered this problem? And if so, do you know what the root cause might be and how to overcome the problem? If so, please let me know in the comment section of the post.

    (more…)

  • Animated Races of the 4 Big Football Leagues

    Complementing the previous post: Animated Races of the 4 big Football Leagues in Europe: Premier League, Serie A, La Liga and Bundesliga

    297 words, ~1.5 minutes read

    4 League Logos

    The previous article showed an an Alternative to the Bar Chart Race in Microsoft Excel.

    As an example, the workbook visualized the results of the English Premier League of this season (2019/2020) in an animated chart.

    A few people apparently liked the visualization. I received a couple of emails and LinkedIn messages asking, if I could also provide the same workbook for other football leagues.

    No sweat.

    Here are the according Excel workbooks for Italy’s Serie A, Spain’s La Liga and the German Bundesliga:

    Download Animated Serie A 2019/2020 (zipped Excel workbook, 1.4MB)

    Download Animated La Liga 2019/2020 (zipped Excel workbook, 2.6MB)

    Download Animated Bundesliga 2019/2020 (zipped Excel workbook, 1.6MB)

    And for the sake of completeness, here is the link to the Premier League version again:

    Download Animated Premier League 2019/2020 (zipped Excel workbook, 2.8MB)

    Please note that

    • Except for the Bundesliga, all leagues are still ongoing. The data in the workbook contains only the results up to July 9, 2020. If you want to have a full view of the season, you will have to complete the results on the worksheet [Data] during the upcoming weeks. The fixtures of the remaining matchdays are there already, but the results are missing
    • The workbook for Italy’s Serie A contains an inaccuracy. Just like in the other three leagues, teams tied in points are ranked by Goal Difference first and Goals scored second. This is not correct for Italy: in Serie A, the tie breaker are the matches of these two teams (head-to-head records). Thus, the final table shown in the workbook might not be the official / correct one

    Stay tuned.
  • An Alternative to the Bar Chart Race

    An alternative solution to the controversial animated Bar Chart Races in Microsoft Excel

    1,276 words, ~ 6.5 minutes read

    Alternative to the Bar Chart Race - Intro

    The other day, I watched an as interesting as entertaining dispute between Andy Kirk and Andy Cotgreave about the popular Bar Chart Races: Data Viz Debate: Is the bar chart race more than just a gimmick?

    Although I truly admire Andy Kirk’s work, I am with Andy Cotgreave, here. I wouldn’t go so far to call them the “fidget spinners of data visualization”, but I find them hard to follow, especially when the speed of the animation is too fast.

    Last week, Philip Treacy of MyOnlineTrainingHub published a post and a workbook, how to do a Bar Chart Race in Microsoft Excel. Philip visualized the 2019/2020 Premier League results in an animated Bar Chart. I am a big fan of Mynda and Philip’s MyOnlineTrainingHub, which is definitely one of the best Excel websites worldwide.

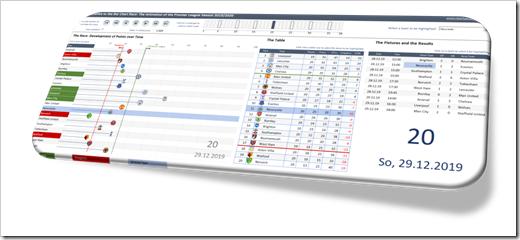
    This made me think. Although I love Philip’s work, I am not a fan of the Bar Chart Race. So, how would I approach this? Today’s post provides my solution of an alternative for animated Bar Charts. As always, the post comes with the Excel workbook for free download.

    (more…)

  • A practical Example for Dynamic Storyboards

    A more practical use case for Dynamic Storyboards in Excel: support the Animation of 2-dimensional data by showing the years before and after the current year on a Storyboard

    717 words, ~3.5 minutes read

    The previous post Dynamic Storyboards in Excel showed how to create small multiples (or panel or trellis charts) for 2-dimensional data in a sequence and let the user decide dynamically, how many small multiples shall be displayed. To describe the technique, the article used a kind of funny, but pointless data set: a part of an episode of the Italian cartoon series La Linea.

    Well, creating a dynamically sized comic strip in Excel is a funny little example. But what’s the point here?

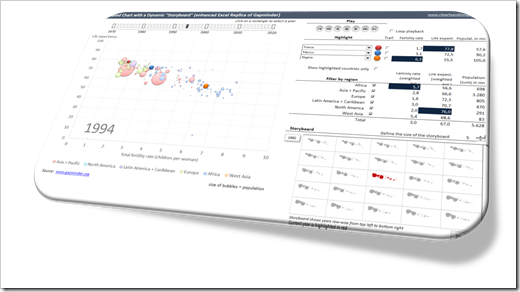
    Gapminder Replica with Storyboard IntroHere’s the point: a Dynamic Storyboard may well be worth considering for a more serious dashboard, too. For instance, a Dynamic Storyboard may support a chart which displays the data for the periods one by one in an animation. The Storyboard can be very useful by showing the data in the context of a user-defined number of years before and after the current period. This can help to better understand the development of the data over time or to discover patterns.

    Today’s post will show how a Dynamic Storyboard may support an animated chart using the example of the Gapminder Replica in Microsoft Excel, published here back in 2014. As usual, the article comes with the workbook for free download.

    (more…)

  • Dynamic Storyboards in Excel

    How to create a Dynamic Storyboard of Small Charts (similar to Small Multiples, Panel or Trellis charts) in Microsoft Excel

    812 words, ~4 minutes read

    The article Motion Chart Excel Template used a small sequence of an episode of the Italian cartoon series La Linea to demonstrate how a chart can be animated in Microsoft Excel. I also used the same data in one of my entries to a Tableau data viz contest: Tableau’s Viz as Art Contest – My Entries.

    Since it is a cartoon series, it is kind of obvious to also think about visualizing the data in a comic strip (or what I will call storyboard hereafter).

    Today’s challenge is to make the size of the storyboard dynamic, i.e. let the user decide with one mouse click, how many images shall be displayed.

    Dynamic Storyboards in Excel Intro

    This article describes how to do this in Excel and – as usual – comes with the example workbook for free download.

    (more…)