A Collection of Choropleth or Filled Maps of Italy in Microsoft Excel
 Heads-up: today’s post is dedicated to my friends and readers in Italy. You will certainly only be interested in this article, if you are working in Italy and/or with Italian data.
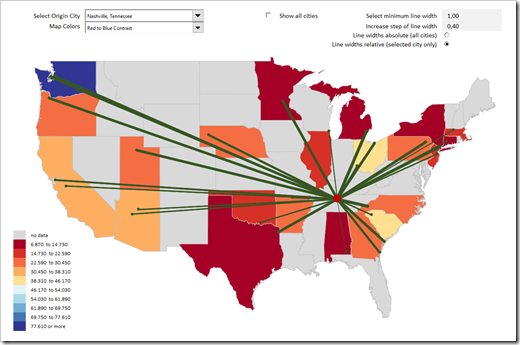
If not, you can easily skip today’s post. It does not include any new ideas, it is only new wine in old wineskins: a collection of Choropleth Map techniques (already published here), applied to maps of Italy for different levels of detail.
ClearlyandSimply is a special interest blog with only very few readers. Most of them are located in the United States, but when I am looking at the web traffic coming from Europe, Italy is always ranked among the top 3, way ahead of e.g. France or Spain.
I do not exactly know why. I have a hunch, though:
Back in 2014 and 2015, I helped my friend Marco Nicolucci creating Tableau visualizations of the history of the Serie A (Italian football, or calcio as you say) and the Rugby World Cup for La Gazetta dello Sport. As of today, both visualizations are still available on the Datamania site of La Gazetta:
If the visualizations should no longer be available on La Gazetta dello Sport, you can also find copies on my Tableau Public Profile.
So, maybe the publications on La Gazetta dello Sport drove some traffic from Italy my way.
Also, maybe my Italian internet friend and highly esteemed colleague Roberto Mensa spread the word about my blog. You probably know Roberto. If not, you definitely missed something. Roberto is the guru for data visualization with Microsoft Excel, not only in Italy, but throughout Europe. Together with Krisztina Szabó and Gábor Madács from Hungary, he is running a website called E90E50. I highly recommend to check out the E90E50charts – Excel Charts Gallery, you will find truly amazing work there, all for free download.
Well, wherever the traffic comes from, this post is for my Italian readers:
A collection of 6 templates for creating Choropleth Maps of Italy in Microsoft Excel. All of them are ready to use. Simply download the workbook(s) you like, replace the dummies by your own data and you are good to go.
