• Bluffing Tableau Actions with Microsoft Excel

    Selected techniques to emulate a Tableau lookalike dashboard using Microsoft Excel, including some interactive features similar to Tableau Actions

    Actions - Clapperboard ExcelThe recent post described the power of Tableau Actions. Tableau actions allow you to add context and user-defined interactivity features across your workbook. If the user clicks on one of your visualizations, Actions give you full control over what should happen on other worksheets or visualizations. Setting up a Tableau dashboard with various actions like filtering, highlighting and linking to web pages is a piece of cake.

    How about Microsoft Excel? Is it possible to implement a similar interactivity on a Microsoft Excel dashboard? Yes it is.

    Today’s post describes a set of techniques and tricks to build a replica of the Tableau 50 most prominent summits on earth dashboard using Microsoft Excel. As always, including the workbook for free download.

    (more…)

  • The Power of Tableau Actions

    How to create highly interactive Tableau dashboards using actions: a step-by-step tutorial and an example workbook

    Action - Tableau ClapperboardEven if you are creating the most basic chart with Tableau Software, the visualization already includes a great set of interactive features without the need for using special functionality: clicking on a data point highlights this point and shades off all others. Clicking on an entry in a color legend highlights all data points belonging to this category. Hovering over data points displays tooltips with all used underlying data, and so forth.
    However, Tableau offers even more than that: Tableau actions. Basically, actions are Tableau’s way of sending user interactions across the workbook. The user selects a data point of one visualization and actions give you full control of what is supposed to happen on the other visualizations and worksheets.

    Today’s post includes a detailed how-to tutorial on the power of Tableau actions:

    • what are actions and what can you do with them,
    • what types of actions are possible and
    • a step-by-step tutorial on how to use actions on a dashboard

    The tutorial is based on example data of the 50 most prominent summits on earth and provides a Tableau Public visualization of the final result.

    (more…)

  • The Revenue Potential of Billing Increments

    A Microsoft Excel simulation model to reveal the revenue potential of billing increments in mobile or fixed-line tariffs

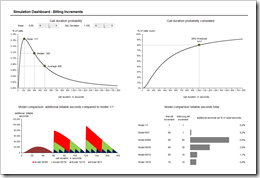
    Billing Increment Simulation Dashboard - click to enlargeBe honest: do you know which incremental billing model is included in your mobile phone or fixed line tariff? No worries, I suppose most people do not know. However, incremental billing models represent a considerable part of mobile or fixed line operators’ revenues.

    But what is incremental billing? It means that carriers are pricing calls in slices longer than a second. Full minute billing means – for instance – that you are paying two full minutes, although your call was only 61 seconds long.

    How big is this effect of additional revenues? How much revenues do carriers make by using incremental billing?

    Today’s post presents a simulation model to reveal and evaluate the revenue potential of different billing increment models. As always including the Microsoft Excel workbook for free download.

    (more…)

  • FIFA World Cup Scorers Statistics with Tableau

    FIFA World Cup scorers statistics by team and tournament from 1930 to 2006 visualized with Tableau Software

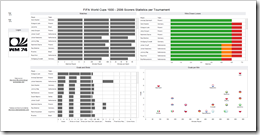
    FIFA World Cup Scorers Stats per Tournament - click to enlargeThe recent article FIFA World Cup Statistics with Tableau included a dashboard visualizing statistics of the FIFA World Cups from 1930 to 2006 by team, provided on Tableau Public.

    Today’s post is a follow-up to that article: FIFA World Cup scorers statistics from 1930 to 2006 on two different dashboards.

    (more…)

  • Tableau Replica of Curtis Steiner’s 1,000 Blocks

    Emulation of Daniel Ferry’s Celtic muse Excel workbook using Tableau Software

    Daniel Ferry’s blog Excel Hero is a source of permanent inspiration for me. In a recent article called Animate cumulative data with Tableau, I described how to use a custom SQL data connection to show cumulative data using Tableau’s page shelf. This post was inspired by one of Daniel’s great articles: Excel Location Mapping.

    In true tradition of stealing Daniel’s ideas, today’s short post contains another replica of one of his Excel workbooks using Tableau Software: Daniel’s implementation of the "1,000 Blocks" sculpture by Curtis Steiner (unfortunately without the soundtrack, of course…).

    Here is an animation of a selection of 10 out of 78 slides:

    1,000 blocks

    Tableau Public does not support the slide show of pages using the playback controls. Thus, I decided not to publish on Tableau Public. Instead, here is the Tableau packaged workbook for free download:

    Download 1,000 Blocks Celtic Muse (Tableau Packaged Workbook, 2640.7K)

    To open this workbook you need Tableau 5.2 (14-day free trial) or the free Tableau Reader.

    Last, but not least:

    Daniel, many thanks again for sharing your fabulous work, for the time you took to review my Tableau workbook and for your permission to use your idea here. Special thanks go also to Daniel’s wife and daughter who helped him with the encoding of 78,000 (!) tiles. Thank you very much.