Category: Charts

  • Bluffing a Visual Cross-tab with Excel

    How to create a Tableau lookalike cross-tab chart with Microsoft Excel

    Matt Grams, author of Bullet Graphs for Excel: A Simple Way? is kind enough to contribute another guest post here on Clearly and Simply, this time discussing how to create cross-tab charts with Microsoft Excel.

    Cross-tab Chart - click to enlargeTrellis charts. Panel charts. Visual cross-tabs. Cross-tabs. Variations of small multiples. Whatever you want to call these charts, one thing seems clear to me: Tableau offers aesthetically restrained yet beautiful implementations.

    So how about constructing a visual cross-tab with similar aesthetics in Excel? Today’s post describes the how-to, including an Excel workbook with detailed explanations for free download.

    (more…)

  • Background Image Maps with Tableau

    Tableau discovers the world – more detailed maps by using background images and a little trick in Microsoft Excel

    © Gerd Altmann / pixelio.deTableau Software offers a very easy way of overlaying data on a map, even without requiring the geographical references (latitude and longitude) in the data source. It automatically identifies field names in your data that are appropriate for visualizations on a map, like state or county and generates the according latitudes and longitudes.

    If you are using data of the United States, Tableau provides a very high level of detail (state, county, zip code area) and displays the boundaries and names of the regions on the underlying map. You can even enhance the visualization with a choropleth map showing a variety of predefined US census data.

    For other counties of the world, however, Tableau does not (yet?) provide this level of detail. In a data source of Germany, for one, Tableau automatically identifies the 16 states and shows the state boundaries on the map. But that’s it. Higher levels of detail like counties (Regierungsbezirke, Landkreise, etc.) or even zip code areas are not available.

    Of course, the folks over at Tableau Software have been smart enough to implement a very easy workaround to overcome this: Tableau provides an option to overlay the data on any given image, e.g. on a picture of a map. Prerequisites for this workaround are a picture of the map and the latitudes and longitudes in the underlying data source. Usually both are easy to find and download somewhere on the Internet. Sometimes, however, the geographical references in your data do not exactly fit to the areas on your map image and Tableau’s visualizations will not be located exactly in the center of the according region.

    Today’s post describes this problem using data based on German zip code areas and provides a how-to-tutorial, a Tableau packaged workbook and a little bonus track for my friends in Lithuania.

    (more…)

  • Bullet Graphs for Excel: A Simple Way?

    A guest post by Matt Grams discussing an alternative solution of creating bullet graphs with Microsoft Excel

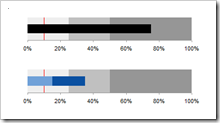
    Bullet Graphs - click to enlargePreamble:

    We proudly present the first guest post here on  Clearly and Simply: Matt Grams describes a very interesting alternative approach of creating bullet graphs in Microsoft Excel without using VBA.

    When you need one or more horizontal bullet graphs in an Excel spreadsheet, what do you do if…

    1. you work exclusively in Excel 2003 or earlier, 
    2. you don’t want to use a 3rd party add-in,
    3. you want your spreadsheet to be free of VBA, and
    4. your bullet graph must have a professional appearance?

    Faced with this scenario of apparently limited options, you’re sure to come across Charley Kyd’s tutorial at ExcelUser. Attempting to build a bullet graph with this method was a useful exercise for me, but the approach left me flustered at the complexity of the data arrangement and chart set-up. If making just one bullet graph was that hard, what are you going to do when you have multiple bullet graphs to implement? Furthermore, not having the bullet graph data values in a single row was far from ideal.

    This post describes an alternative and simpler approach of how to create bullet graphs with Microsoft Excel, including step-by-step tutorials and an example workbook for free download.

    (more…)

  • Visiting a friend

    Chandoo's KPI Dashboards revisited – the Box Plots

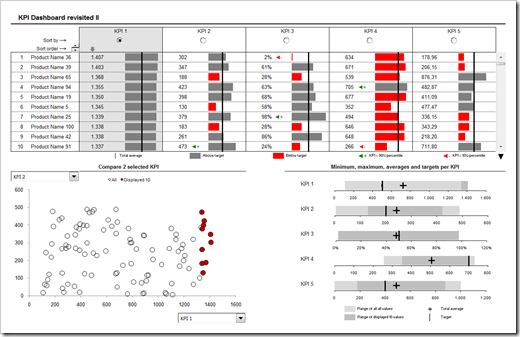
    In summer 2008 my friend and Microsoft Excel MVP Chandoo was kind enough to give me the opportunity of contributing guest posts to his excellent blog Chandoo.org. Actually Chandoo even featured a whole 6 post series on how to create interactive KPI dashboards with Microsoft Excel. Here is a screenshot of the final dashboard:

    PHD KPI Dashboard - click to enlarge


    The last part of the series was about box plots to visualize the distribution of the data (Box Plots Excel Dashboards Tutorial), including average and target values. At that time Chandoo and I decided to apply Occam’s razor and we restricted the tutorial to a simplified version of box plots, working only for data sets with positive values.

    This follow-up post on my own blog is about how to create these box plots for all kind of data distribution, i.e. positive and negative values.

    (more…)

  • There is more than one way to heat a map

    2D Tabular Heatmaps with Microsoft Excel

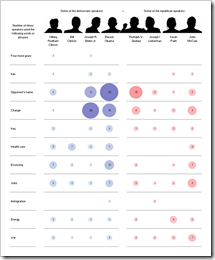
    NYT Speakers XL Replica - click to enlarge Inspired by a NY Times chart, Juice Analytics recently had a post and a discussion on bubble chart heat maps: Bubble, bubble toil and trouble. Chris Gemignani wrote:

    “The first tool we tried, simply on principle, was Excel 2003. As expected, making a NY Times quality bubble chart in Excel 2003 is a hard problem.”

    Juice Analytics is one of my favorite blogs on visualization and I learned a lot from the blog and website. But in this case I do not agree at all. And it seems as if I am not alone.

    What had to come, came. Some of us – including myself – could not let this rest.

    • I used Fabrice Rimlinger’s famous Sparklines for XL (free download here) and created a replica of the NY Times chart. Fabrice was kind enough to publish this on his blog (Yes, we can) and his own version with an improved visualization using bar charts (Stick to the classics?).
    • Two days later my friend and Excel MVP Chandoo showed Visualizing Search Terms on Travel Sites, a bubble-chart solution with plain old Excel (no VBA).
    • Last, but not least: Andreas Lipphardt of xlCubed was ahead of his times and had a post on creating heatmap tables with Excel based on bubble charts already in August 2008.

    Conclusion: Yes you can. It is not a hard problem to create quality heat maps with Microsoft Excel.

    But let’s take one step back. What if you don’t want to use the size of the bubbles for visualization? What if you want to create a classic heat map, i.e. the higher the value, the darker the fill color of the cell and vice versa? Following a definition like the one on Wikipedia:

    “A heat map is a graphical representation of data where the values taken by a variable in a two-dimensional map are represented as colors.”

    Can you create a classic 2-dimensional tabular heatmap with Microsoft Excel as well?

    Yes, you can. And there is more than one way to skin the cat. This post shows the different options and includes all examples for free download.

    (more…)