Author: Robert

  • So long, and thanks for all the fish

    TypePad is shutting down on September 30, 2025 and this also means the end of this blog

    So long, and thanks for all the fishRecently, TypePad announced that it will discontinue its services effective as of September 30, 2025. This blog used TypePad as a blogging platform since the blog started in 2009.

    Bad news: with TypePad shutting down, this blog will also go away for good.

    I admit, I haven’t done much on this blog for a long time (except for one new post some days ago), so this blog was already sleeping for quite a while.

    That being said, since 2009, I published a total of 176 articles here, focussing on data visualization, dashboards, techniques and tricks using Microsoft Excel and Tableau. All content was provided for free. No ads. All workbooks for free download. No strings attached.

    All this content will be gone soon. So, if you are still interested in surfing through the blog posts and downloading some maybe helpful workbooks, time is running out. As of today, you have a little more than 4 weeks left.

    Finally, please bear with me that I can’t acknowledge all the people by name, who helped me during this great journey of blogging. They are just too many.

    So, to all of you who contributed guest posts, supported me by reviewing my drafts, linked to my blog on your own sites, mentioned me on LinkedIn or elsewhere, commented or simply read my posts: thank you so much!

    So long, and thanks for all the fish.

  • Select and Highlight across an Excel Dashboard

    Interactive Excel Dashboard visualizing unemployment rates in the EU. Select a country, filter by age group and gender, and see the selection highlighted across all visuals on the dashboard

    1,176 words, ~6 minutes read
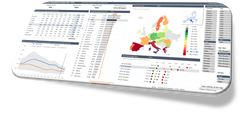
    Excel_EU_unemployment_rates_dashboard10 years ago, I published a post demonstrating how to highlight one selected item across all charts and views on an interactive Excel Dashboard:

    Highlighting on Excel Dashboards

    Unlike most of my other publications here, that post actually did make some friends.

    And even more, it won a real fan: my good friend and Microsoft Excel MVP Carlos Barboza (Carlos’ LinkedIn Profile, Carlos’ blog: Spilled Graphics) liked this workbook so much that he even included it in some of his presentations, e.g. his great speech on the Global Excel Summit in 2024.

    Recently Carlos asked me, if I could provide a version with an updated data source. Of course I can. And while I was at it, I also made a couple of (hopefully helpful) changes.

    Today’s article provides this updated version of my European Union Unemployment Rates Dashboard from 2015. It also briefly discusses why interactive dashboards in Excel are still a viable option, even nowadays with Tableau and Power BI.

    (more…)

  • London Excel Meetup Workbooks

    The workbooks used in my presentation on “Analytical and Interactive Dashboards in Excel” at the London Excel Meetup, September 3, 2020

    233 words, ~1 minute read

    London Excel Meetup GroupEarlier today (September 3, 2020), I had the honour and privilege to give a little presentation about Analytical and Interactive Dashboards in Microsoft Excel at Tea Kuseva’s and Alan Murray’s great London Excel Meetup.

    For everyone who attended the session and anyone else interested, here are the workbooks used in my presentation for free download.

    This is the showcase of the interactive English Premier League Dashboard shown at the beginning of the session: 

    Download Dashboard Showcase Premier League (zipped Excel workbook, 2.5MB)

    And this is the workbook used to present the different tips and tricks:

    Download Analytical and Interactive Dashboards (zipped Excel workbook, 2.2MB)

    I have to admit, the live presentation and performance was a bit sloppy on my side (my apologies), so I recommend to download and dissect the workbooks to get the most out of the meetup. I think both workbooks are worth a look.

    Many thanks go to Tea Kuseva and Alan Murray for organizing the event and having me, to Carlos Barboza for suggesting me as a speaker and of course to everyone who took the time to attend the session.

    If you have any feedback or questions, please leave me a comment here or contact me by email.

    Stay tuned.

  • Visual Workbook Navigation with a Chart Carousel

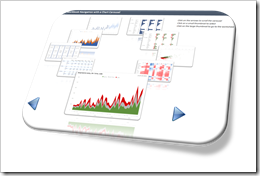
    A Carousel of Charts as a visual and interactive Navigation Control for Microsoft Excel Workbooks

    726 words, ~4 minutes read

    Visual Navigation IntroIf your Excel workbook has many output worksheets, you should provide your users with an option to facilitate the navigation within the model.

    Sure, the user always has the option to right click on the arrows left to the first tab and select any worksheet from there, but this requires that she/he exactly knows where to find what.

    It is best practice to give the users guidance regarding the content of your model and to enable them to easily navigate to the sheets they are most interested in. Usually, you insert an extra worksheet containing a list of all tabs with hyperlinks or buttons to quickly navigate to those sheets.

    You are interested in something more visually compelling? If so, you came to the right place. Today’s article provides a visual workbook navigation control with a chart carousel dynamically displaying the content of the relevant sheets. The user can easily browse through all views, select the desired one and get to the view with one mouse click. As always, the post comes with an example workbook for free download.

    (more…)

  • A Neural Network to solve Travelling Salesman Problems in Excel

    Artificial Intelligence in Microsoft Excel: watch a Neural Network solving a Travelling Salesman Problem

    869 words, ~4 minutes read

    Neural Network solving TSPs in Excel - IntroTerms like Artificial Intelligence, Machine Learning, Deep Learning and (Artificial) Neural Networks are all over the place nowadays.

    If you are reading Tech News, Data Science blogs or your LinkedIn feed, it will be little short of a miracle, if you don’t see one of those expressions at least once.

    This is just the revival of those techniques, though. Neural Networks, for one, have been around for many years. In the mid 1990s (!), I did some research and wrote my thesis about Artificial Neural Networks. We even had a blog post here on this topic 10 years ago: Where the rubber meets the road. For whatever reason, that article didn’t make many friends. I was always wondering why. Probably too academic and not visually appealing enough.

    Now, with the recent revival of Artificial Intelligence and Neural Networks, I decided to give it another shot. Today’s post provides an updated, improved version of a Neural Network solving Travelling Salesman Problems in Microsoft Excel.

    You always wanted to watch a Neural Network solving an optimization problem? If so, this article is for you. Either watch one of three videos provided in the post or download the Excel workbook and play around with it at your own speed. No add-in or third party software necessary. All you have to do is to enable macros.

    (more…)