A more practical use case for Dynamic Storyboards in Excel: support the Animation of 2-dimensional data by showing the years before and after the current year on a Storyboard
717 words, ~3.5 minutes read
The previous post Dynamic Storyboards in Excel showed how to create small multiples (or panel or trellis charts) for 2-dimensional data in a sequence and let the user decide dynamically, how many small multiples shall be displayed. To describe the technique, the article used a kind of funny, but pointless data set: a part of an episode of the Italian cartoon series La Linea.
Well, creating a dynamically sized comic strip in Excel is a funny little example. But what’s the point here?
 Here’s the point: a Dynamic Storyboard may well be worth considering for a more serious dashboard, too. For instance, a Dynamic Storyboard may support a chart which displays the data for the periods one by one in an animation. The Storyboard can be very useful by showing the data in the context of a user-defined number of years before and after the current period. This can help to better understand the development of the data over time or to discover patterns.
Today’s post will show how a Dynamic Storyboard may support an animated chart using the example of the Gapminder Replica in Microsoft Excel, published here back in 2014. As usual, the article comes with the workbook for free download.
The Basic Workbook and the Enhancement with a Dynamic Storyboard
Back in 2014, I published a Gapminder Replica in Microsoft Excel. The data and the dashboard are a great example to show how a Dynamic Storyboard may support the animated chart.
The enhanced version of the workbook uses the same technique for creating the dynamic storyboard as described in the previous post.
There are only 2 differences:
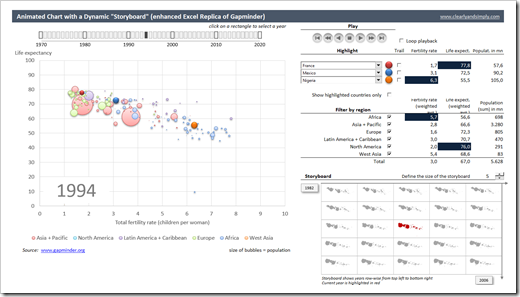
- The start year (top left of the storyboard) is not manually selected by the user, but controlled by the animation
- The currently selected year, i.e. the one shown in the large Bubble Chart at top left, is highlighted with a red fill color of the bubbles in the storyboard.
There are only a few minor changes necessary. The basic technique and formulas for creating the storyboard are exactly as described and used in the previous post.
The Result
Here is what you get:
 If you haven’t seen the Gapminder Replica in Microsoft Excel before, I recommend to check out the other functionalities of this dashboard:
- With the play buttons at top right, you can start and stop the animation, move forward or backwards (delayed or fast), go to the first or last year. You can also choose whether you want the animation to loop with the checkbox, i.e. start at the beginning after reaching the last year in the data
- The rectangles above the chart visualize the time line and the current year (dark rectangle) and let you select one specific year by simply clicking on any given rectangle. This will stop the animation, but you can then start it again from this selected year
- The highlight section beneath the play buttons lets you define 3 countries to be highlighted in different colors and you can use the “Show highlighted countries only” checkbox to only display these 3 countries in the chart and the storyboard
- You can also decide with the checkboxes right to the countries whether or not a trail of the development over the years shall be visualized (in the main chart, not in the storyboard, of course)
- The table right to the drop down lists shows the measures of the highlighted countries and visualizes the maximum value of fertility rate and life expectancy with a blue fill color
- In the “Filter by region” section you can select which continents shall be displayed (in the main chart and the storyboard)
- Like in the highlight section, the table shows the metrics (weighted averages of fertility rate and life expectancy, sum of population). Again, the maximum values are highlighted by a blue fill color
- Finally, you can choose the size of the storyboard (count of rows and columns) using the spinner right above the view
Download Link
If you are interested, here is the workbook for free download:
Download Gapminder Replica w/ Storyboard (zipped Microsoft Excel Workbook, 1.8MB)
Stay tuned.
Leave a Reply