US Choropleth Map by County per State – a 4th Option

Another option to display a Choropleth Map of the United States by County for one user-selected state in Microsoft Excel

The previous post presented three different options to implement a US Choropleth Map by County per State in Microsoft Excel. One approach showed the entire map of the United States and highlighted the selected state (option 2), whereas option 3 filtered the data and only plotted the counties of the selected state.

It was again Leonid Koyfman (who else?), who provided me with an interesting idea for another alternative: Leonid suggested in this comment to combine options 2 and 3 and show both maps in one view. This requires more real estate on the dashboard, but it also combines the advantages of both approaches: it provides a zoomed map of the selected state and keeps the context of this state on the map of the entire USA.

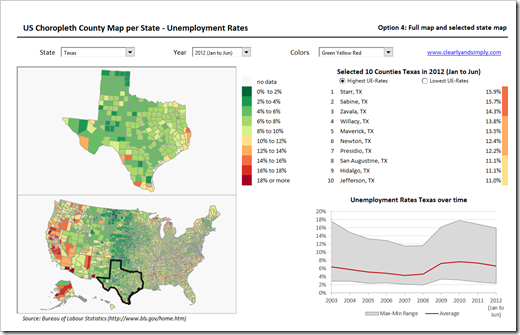
Since the technique will certainly be most useful on a dashboard showing more than just the maps, I created an example visualization with two additional views:

US Choropleth Map by County per State Dashboard - click to enlarge

  • On the left side of the dashboard the two maps (zoomed selected state and USA) are displayed
  • At top right of the visualization a table lists 10 selected counties of the current state: the 10 counties with the highest or lowest unemployment rates. A small new VBA routine assigns the according bin color to each of the 10 counties in the narrow column right to the table
  • The band chart at bottom right visualizes minimum, maximum and (unweighted) average of unemployment rates of all counties in the selected state over time

This is just one example how the technique of visualizing maps for a user selected state could be integrated in a more complex dashboard.

If you want to use this on your own dashboard, you may want to play around with the size of the maps and where they are located. Size and position of the zoomed state map are defined by the named range “myMapView”. You can adjust the zoomed map by simply changing the cell reference of this name. As for the map of the USA, you have to group all shapes of the US map first, then resize and reposition this group and finally ungroup it again.

The major disadvantage remains, though: the zoomed map of the selected state makes the distortions visible. These distortions are inevitable in the process of converting SVG-files to freeform shapes in Excel. Well, at least I couldn’t find a way to avoid them. The problem depends on the size of the selected state: Texas and California, for instance, still look good as a zoomed map. Rhode Island and Connecticut definitely don’t. A crucial downside, no doubt about it. Unfortunately I do not have a solution for this. A map would be needed which will not be distorted in the ungrouping process, but I couldn’t find a better map than the one used here.

If you are interested, here is the link to download the zipped Excel workbook:

Download US Choropleth County Map per State (zipped Excel workbook, 2.4 MB)

Many thanks go to Leonid for the idea.

Stay tuned.
Comments

10 responses to “US Choropleth Map by County per State – a 4th Option”

  1. Marco Fulvio Avatar
    Marco Fulvio

    Pure gold… your blog is one of the most useful out there Robert

  2. Matt Avatar
    Matt

    Really impressive. Besides looking top notch, this dashboard could have many practical uses when leveraging other us-geo data sets, and serve as inspiration for other dashboard designs, be they in Excel, web, or other. One item I would want to experiment with is the “Selected 10 Counties…” section; e.g., it would be interesting to see the impact of a barchart to the right or left (if left, then reverse bar) of % val.

  3. Hugo Avatar
    Hugo

    Thank you so much for sharing. Your site is truly awesome.

  4. linda Avatar
    linda

    Thanks for sharing.
    One question, is here a way to show state borders in black outline? one can think of use dual axis to overlay state borders but the tooltips for counties are there.

  5. Robert Avatar

    Linda,
    in the module modChoroplethMap, simply replace
    .Line.ForeColor.RGB = 9868950 ‘ grey line color
    by
    .Line.ForeColor.RGB = C_COLOR
    and the borders of the states will be black instead of grey after you selected another state on the dashboard.
    I am sorry, but I do not understand the other part of your question. There is no such thing as a dual axis (this is not a chart, just a collection of freeform shapes) and there are no tooltips.

  6. linda Avatar
    linda

    hi, Robert:
    Thanks for replying back. I am new to Tableau and don’t quite understand what “in the module modChoroplethMap” is and where to get to that.
    regards

  7. Robert Avatar

    Linda,
    this is not Tableau, it is an Excel workbook with VBA code (Visual Basic for Applications). The code colours the shapes of the map.
    To change the code, press ALT-F11 to open the Visual Basic editor, select the module modChoroplethMap in the Explorer pane on the left, search for the line of code I mentioned in my previous comment and make the changes I described. Finally run the code by e.g. selecting another state on the dashboard. This should do the job.

  8. Himank Avatar
    Himank

    This site is awesome…even after spending hours on this site, your each post surprises me!
    This is great! Keep up the good work.

  9. Greg Avatar
    Greg

    I appreciate all of the hard work you have done on this topic. Have you ever thought to render a map of selected counties? Example: Select all of the East Coast State Counties etc.. Or a region of Texas vs the whole state? I think this would be beneficial to review medium sized regions vs one state or whole country. Thank you for reviewing my comment!

  10. Robert Avatar

    Greg,
    actually, there wouldn’t be much to change in the implementation if you would want to compare e.g. a selected region of a state to the entire state. The main question would be the user interface: how would you enable the user to easily select the region he/she wants to compare to the entire state? There are options to enable the user to select regions using the mouse.
    Have a look here:

    Selecting and Highlighting Areas on Excel Charts

    However, this is designed for the selection of an area on a real Excel chart. Easily selecting areas which are nothing else than freeform shapes on an Excel worksheet are a completely different story. I am sorry, but I do not think there is an easy way to implement your idea.

Leave a Reply

Your email address will not be published. Required fields are marked *