Multi-select regions on an interactive Excel Dashboard
Have you ever built a data-analysis model in Microsoft Excel for a database containing a geographical dimension like state, county, ZIP-code areas, sales region, etc.? If so you probably wanted to integrate a user-friendly control feature on your dashboard that enables the user not only to select one region, but to filter the data by any combination of regions. E.g. show the total revenues for the sales regions West and Central.
You need a multi-select filter control. This post shows different options of how to do this and includes the example files for free download.
A preliminary remark
I am living in Germany and ~80% of my clients are based in Germany. So it is no big surprise that I am using the states of Germany in my examples. Probably pretty useless if you are living in the United States, France or India, but it should be no sweat to adopt the techniques to any other set of regions.
Option 1: A list with checkboxes
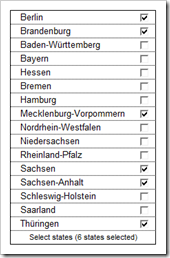
This is the easiest way to allow multi-select inputs and does not need VBA. Create a list of all regions on your dashboard and add one checkbox from the form controls toolbar for every region.
Here is the file for download:
Download Multiselect regions with checkboxes simple (Excel 97 – 2003, 62.5K)
If you want to, you could add 2 small buttons and write 2 simple VBA macros to check all and uncheck all with one click. Another good enhancement would be conditional formatting to highlight the selected rows with e.g. a darker fill color or a bold font.
Download the enhanced workbook here:
Option 2: A Multi-select ListBox
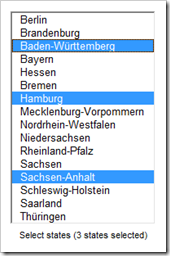
This is still pretty straight forward, but you need some knowledge about VBA. Add a ListBox from ActiveX Control toolbar, set the multiselect property to 2, define the fill range and write a small VBA routine to handle the user selection. Well, I admit this was a pretty condensed how-to, but any search engine, a book about VBA or even Excel’s help function will provide all further information you may need.
The ListBox is usually my favorite since it is quick and easy to implement and needs the least amount of real estate on the dashboard.
Download the file:
Download Multiselect regions with ListBox (Excel 97 – 2003, 64.5K)
Care for something more fancy? Here you go:
Option 3: Clicking on a map
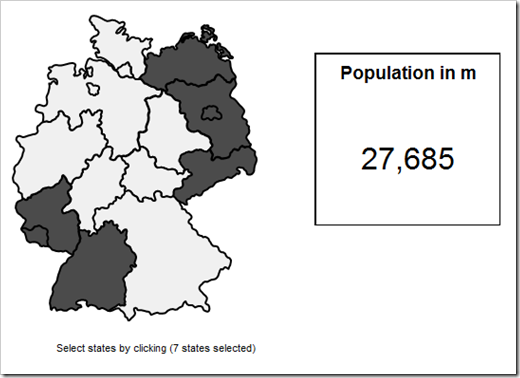
How about using an interactive map? Let the user select and deselect regions by clicking on the map and highlight the selected regions with a darker fill color. All you need is a map with editable regions (i.e. every region is one shape), names for the shapes (same procedure as if you would define a name for a range) and a couple of very small VBA-routines assigned to the shapes. That’s it.
Here is the file for download:
Download Multiselect regions with an interactive map (Excel 97 – 2003, 108.5K)
Please use this with caution!
Having an interactive map as a filter control is a nifty little feature for a dashboard. But please: before using this technique, answer the following questions:
- Do you have enough real estate on your dashboard for a map?
Usually real estate is the limiting factor on a dashboard. Don’t waste it for a fancy user interface. Use it for visualizing data and presenting information rather than for a nice interactive feature. If you have enough real estate, fine. If not, use a ListBox instead of a map. - Are all users of your dashboard familiar with the location of the regions on the map?
I, for one, am familiar with the German map in this example and I guess I would even be able to name all the states on a European map correctly. What about a map of the United States? Well, I would find California, Colorado, Washington, Florida and some other. But I am ashamed to admit: I do not know where Nebraska is. Somewhere in the Midwest, correct? But which one? You can imagine that I don’t know Wyoming either. I apologize to everyone living there and reading this. I am embarrassed. Even if you are better at geography than I am: How about the countries of Central Africa, the British counties or French ZIP-code areas. Got my point? - Is the map on your dashboard large enough to allow the user to click on every region with ease?
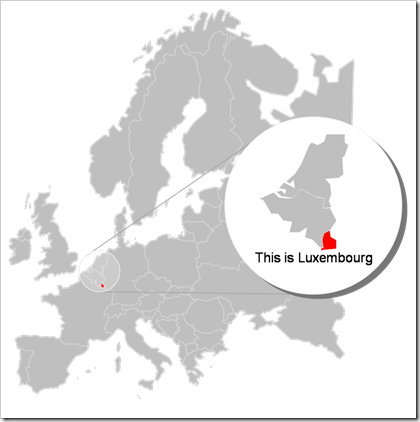
A picture says a thousand words. This is a map of Europe:
Are your eyes good enough and your hands calm enough to click on Luxembourg (on the original map, not on the magnified part)?
If they are, congratulations, but I guess this will not be the case for most of the users of your dashboard. From my point of view a European map of this size is definitely out of the race.
So please do the users of your dashboard and yourself a big favor: Before putting an interactive map for filtering on your dashboard, make sure the answer to all three questions is “yes”. And stick by it! If you have the least doubt, don’t use the map, use a ListBox instead.
Option 4: Clicking on a tag cloud
You can’t use a map but you still want to have something niftier than a ListBox? How about an interactive tag cloud?
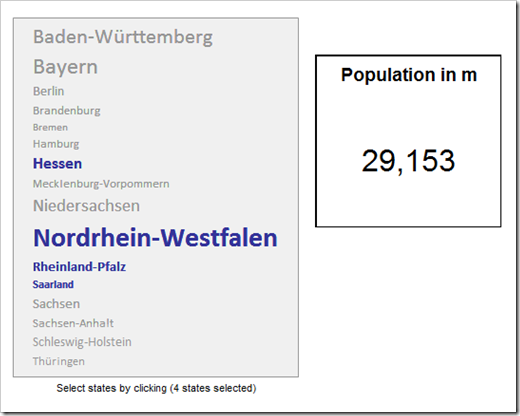
The names of the regions are displayed, the regions can be selected and deselected by clicking and the selected items are highlighted by blue bold texts. What’s the difference to the ListBox? Since it is a tag cloud, the size of the texts represent the weight of the regions, in this example the population. The technique is pretty much the same as for the interactive map, except for using textboxes instead of shapes. Please note that the file for download does not include the routine to create a tag cloud, i.e. determine the different sizes of the textboxes. Maybe I will have another post on creating tag clouds some later day.
Nevertheless, here is the file for download:
Leave a Reply to Robert Cancel reply