Tag: visualization

  • Tableau Replica of Curtis Steiner’s 1,000 Blocks

    Emulation of Daniel Ferry’s Celtic muse Excel workbook using Tableau Software

    Daniel Ferry’s blog Excel Hero is a source of permanent inspiration for me. In a recent article called Animate cumulative data with Tableau, I described how to use a custom SQL data connection to show cumulative data using Tableau’s page shelf. This post was inspired by one of Daniel’s great articles: Excel Location Mapping.

    In true tradition of stealing Daniel’s ideas, today’s short post contains another replica of one of his Excel workbooks using Tableau Software: Daniel’s implementation of the "1,000 Blocks" sculpture by Curtis Steiner (unfortunately without the soundtrack, of course…).

    Here is an animation of a selection of 10 out of 78 slides:

    1,000 blocks

    Tableau Public does not support the slide show of pages using the playback controls. Thus, I decided not to publish on Tableau Public. Instead, here is the Tableau packaged workbook for free download:

    Download 1,000 Blocks Celtic Muse (Tableau Packaged Workbook, 2640.7K)

    To open this workbook you need Tableau 5.2 (14-day free trial) or the free Tableau Reader.

    Last, but not least:

    Daniel, many thanks again for sharing your fabulous work, for the time you took to review my Tableau workbook and for your permission to use your idea here. Special thanks go also to Daniel’s wife and daughter who helped him with the encoding of 78,000 (!) tiles. Thank you very much.
  • FIFA World Cup Statistics with Tableau

    FIFA World Cup statistics by team from 1930 to 2006 visualized with Tableau Software

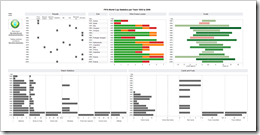
    World Cup Statistics per Team - click to enlarge I have to admit, I am a little late: The FIFA World Cup 2010 in South Africa already started yesterday. And of course there have already been a couple of interesting posts on visualizing the World Cup statistics elsewhere:

    Chandoo had a couple of nice posts using Microsoft Excel: FIFA World Cup Excel Spreadsheets, Football Betting Sheet Template and Official FIFA World-cup Soccer Balls since 1930 in an Excel Chart.

    Ross Perez provided a very interesting visualization of the History of the World Cup on Tableau’s own blog, focused on winning and tie percentages.

    Better late than never. Today’s post includes my 2 cents: a visualization of the FIFA World Cup Statistics since 1930, using Tableau Software and focused on the performance and match statistics per team.

    (more…)

  • Animate cumulative data with Tableau

    Use a custom SQL data connection to animate cumulative data on the page shelf in Tableau

    The Growth of Walmart - click to enlargeInspired by Nathan's Walmart growth movie, Daniel Ferry recently had a very interesting post at his outstanding blog Excel Hero. Daniel presented a beautiful Excel implementation of animating the growth of Walmart, plotting dynamic named ranges on an XY scatter chart against a background image map of the US.

    There is nothing to add to Daniel’s great post and implementation with regards to the use of Microsoft Excel. But how about Tableau? Can you create animations like this with Tableau Software?

    At first sight this should be a piece of cake: If you think of animating data with Tableau, of course the page shelf is the first thing that comes to your mind, isn’t it? Dragging a field (the year of the opening date of the stores in our example) to the page shelf allows you to either manually navigate through all the years or to use the playback controls for a slide show. 

    However, the page shelf creates a view on the currently selected page. Thus, dragging the opening date on the page shelf would show an animation only displaying the location of the new Walmart stores in the current year. At the end of the animation, for instance, the visualization would include solely all stores opened in 2006 instead of all stores opened since 1962.

    Therefore the page shelf and Tableau’s built-in mapping functionality are only half the battle won. We need a little tweak to visualize and animate the cumulative data, i.e. all Walmart stores from the very beginning.

    Today’s post presents a way of emulating Daniel’s Excel implementation with Tableau. As always including the Tableau packaged workbook for free download.

    (more…)

  • Software Project Dashboards – Episode 3

    How to create a Microsoft Excel dashboard to monitor the progress of a software development project (part 3 of 3)

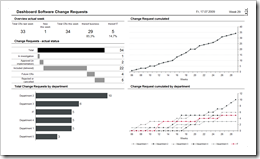
    Dashboard Software Change Requests - click to enlarge This article is the last part of a 3 posts series on software development project dashboards with Microsoft Excel. Episode 1 of the series discussed a software defect statistic dashboard, Episode 2 talked about a test progress and test success dashboard. Today’s post focuses on monitoring change requests, one of the biggest threats to complex software projects.

    Change requests (CR) raised already during the development of the software lead to additional time and cost needed, threaten the project plan and the budget, bear the risk of additional defects and lead to an instable baseline of the software to be tested by Quality Assurance. That’s why you should definitely keep an eye on the development of change requests throughout the development phase of your software project.

    Today’s post provides a minimalist dashboard for monitoring and reporting the actual status of change requests and their development over time. As always including the Microsoft Excel workbook for free download.

    (more…)

  • Software Project Dashboards – Episode 2

    How to create a Microsoft Excel dashboard to monitor the progress of a software development project (part 2 of 3)

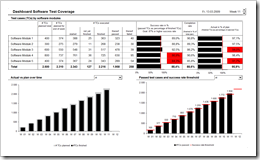
    Dashboard Software Test Progress - click to enlarge This is the second part of a 3 post series on software development project dashboards with Microsoft Excel. Episode 1 of the series discussed a dashboard to monitor the software defect statistics. Today’s article addresses to another very relevant facet in a software development project: The progress and success of testing.

    Testing as the process of validating and verifying quality and suitability of the developed system is at least as important as the number of defects detected. Actually, it goes without saying that testing is the prerequisite of finding software defects. Having said this, it probably would have been better to start the series with this part, but I recognized this too late. My bad.

    Anyway: Today’s post provides a minimalist dashboard to monitor test progress and test success within a software development project. As always including the Microsoft Excel workbook for free download.

    (more…)