Tag: tableau

  • Animate Cumulative Data with Tableau 6

    Create a motion chart and animate cumulative data using the new functionality “Show History” of Tableau 6

    © Pixel King / pixelio.deThe article Animate cumulative data with Tableau described a workaround to visualize the history of data on the page shelf of Tableau’s version 5. The example provided in that post showed the growth of Walmart since 1962 on a map of the United States.

    The workaround included a custom SQL statement in the data connection to create a second date field to be used on the page shelf.

    The workaround did the job, but it came with a couple of serious disadvantages:

    • SQL knowledge needed to create the Custom SQL statement
    • Additional time needed to set up the data connection
    • Extremely slow performance: executing the SQL query after opening the workbook took between one and three minutes
    • Impacts on other data analysis and visualizations due to the artificially bloated data source

    As I already said at the end of the original article: A workaround. No more, no less.

    All that belongs to the past. With Tableau 6 you can easily animate cumulative data on the page shelf using the new feature “Show History”. Today’s post includes a how-to tutorial and the Tableau workbook for direct access here and for free download.
    (more…)

  • Geocoding Databases for Europe

    Databases including latitudes and longitudes of cities and postcodes of most European countries for free download

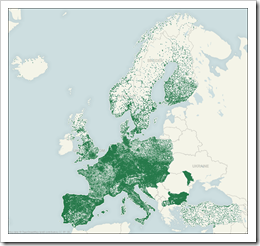
    European PostcodesSoon after publishing Tableau Custom Geocoding outside the US and UK, I received a very interesting email from Richard van Dijk. Richard obviously liked yesterday’s article and he is kind and generous enough to share great geographical databases of European cities and postcodes with us. See a Tableau visualization of the postcodes on a European map in the screenshot left. The databases include the geographical data of more than 250,000 European cites and more than 296,000 postcodes.

    Richard pulled this data out of a 2009 download from geonames.org. With a little help from the Tableau Support team he converted these downloads into geocoding databases accessible with Tableau Software.

    Here is a zipped folder including both databases as CSV files in US standard (point as decimal separator, comma as field separator) for free download:

    Download European Cities and Postcodes US Standard (zipped folder, 3638.3K)

    And here is the same data using the European standard (comma as decimal separator, semicolon as field separator):

    Download European Cities and Postcodes EU Standard (zipped folder, 3638.5K)

    Please be advised that the data does not cover all countries in Europe: Ireland, Greece, Bosnia and Herzegovina, Romania, Serbia, Montenegro, Albania, Ukraine, Belarus and the Baltic States are not included. Furthermore there seem to be some smaller inaccuracies in the European city database. Have a closer look at Spain or Italy for instance.

    Nevertheless, these databases are enormously helpful if you want to import Custom Geocoding into Tableau Software and create a higher level of detail in your geographical visualizations of Europe.

    Many thanks again, Richard. Your contribution is highly appreciated.

    Please visit also Richard’s profile on LinkedIn and follow him on Twitter.

    Finally, may I ask you a favor? If you like Richard’s data and find it useful for your own work, I would highly appreciate if you could drop him a line in a comment here to say thank you for sharing. We shouldn’t take it like a duck to water that Richard is so generous to share his work with us.

  • Tableau Custom Geocoding outside the US and UK

    How to properly import a custom geocoding into Tableau for countries outside the US and the UK

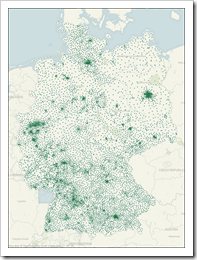
    Postcode Map GermanyI am using Tableau for more than 3 years now and I am living in Germany. To my own surprise I noticed these days that I never used the Import Custom Geocoding feature of Tableau Software. Don’t ask me why. I always had the latitudes and longitudes in the underlying database, I guess.

    A couple of days back, however, a colleague of mine asked for my assistance. He tried to make German postcodes available as a new geographic role in Tableau Software by using Custom Geocoding. He hit a roadblock: it simply didn’t work.

    Thus, I had a look at this feature for the very first time and I faced the same problem: I couldn’t manage to properly import the data. More precisely: I couldn’t import the Custom Geocoding at all!

    Even following a step-by-step tutorial described in the Tableau Knowledge Base (Importing Numeric Geographical Roles) led to the same issue: no import of the Custom Geocoding possible. Problems like this simply drive me nuts. After digging deeper into this, I finally found the root cause of the problem and a solution.

    Today’s post describes how to properly import Custom Geocoding data in Tableau Software, if you are living outside of the US and the UK. The article is based on the example of German postcodes (“Postleitzahlen”, “PLZ2” and “PLZ5”), but the technique should be applicable to any other data set as well.

    (more…)

  • Bluffing Tableau Actions with Microsoft Excel

    Selected techniques to emulate a Tableau lookalike dashboard using Microsoft Excel, including some interactive features similar to Tableau Actions

    Actions - Clapperboard ExcelThe recent post described the power of Tableau Actions. Tableau actions allow you to add context and user-defined interactivity features across your workbook. If the user clicks on one of your visualizations, Actions give you full control over what should happen on other worksheets or visualizations. Setting up a Tableau dashboard with various actions like filtering, highlighting and linking to web pages is a piece of cake.

    How about Microsoft Excel? Is it possible to implement a similar interactivity on a Microsoft Excel dashboard? Yes it is.

    Today’s post describes a set of techniques and tricks to build a replica of the Tableau 50 most prominent summits on earth dashboard using Microsoft Excel. As always, including the workbook for free download.

    (more…)

  • The Power of Tableau Actions

    How to create highly interactive Tableau dashboards using actions: a step-by-step tutorial and an example workbook

    Action - Tableau ClapperboardEven if you are creating the most basic chart with Tableau Software, the visualization already includes a great set of interactive features without the need for using special functionality: clicking on a data point highlights this point and shades off all others. Clicking on an entry in a color legend highlights all data points belonging to this category. Hovering over data points displays tooltips with all used underlying data, and so forth.

    However, Tableau offers even more than that: Tableau actions. Basically, actions are Tableau’s way of sending user interactions across the workbook. The user selects a data point of one visualization and actions give you full control of what is supposed to happen on the other visualizations and worksheets.

    Today’s post includes a detailed how-to tutorial on the power of Tableau actions:

    • what are actions and what can you do with them,
    • what types of actions are possible and
    • a step-by-step tutorial on how to use actions on a dashboard

    The tutorial is based on example data of the 50 most prominent summits on earth and provides a Tableau Public visualization of the final result.

    (more…)