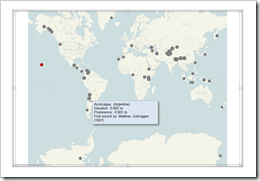
Create Tableau lookalike Chart Tooltips on your Microsoft Excel 2007/2010 Charts
 Let’s call a spade a spade: Microsoft Excel’s chart tooltips are lame.
When talking about tooltips I refer to textboxes that appear when hovering over a data point of a chart with the mouse.
Excel’s chart tooltips show by default the name of the data series, the point (e.g. the category) and the values. There is no built-in feature to change anything about them except for turning the tooltips off in Excel’s options.
However, chart tooltips are a great interactive feature. They give the user the opportunity to easily explore the data and get additional information about selected data points on the chart.
Have a look at Tableau as a benchmark. Tableau allows you to display any information in the tooltips (i.e. any given dimension or measure), to format them and to replace the field names by whatever you choose. There is even much more. For instance: my highly esteemed Tableau blogging colleague Andy Cotgreave showed on the outstanding blog of the data studio how to add conditional formatting to tooltips and even how to implement pseudo bar charts inside of a tooltip. Fantastic work, Andy.
Back to Microsoft Excel. Can we do at least something similar in Excel? Let’s stay humble. I am not dreaming of great formatting features or even the fabulous things Andy did with Tableau. I am talking about just some nice and meaningful tooltips displaying more information than the Excel default does. Is this possible?
Yes, it is.
Today’s post shows how to improve Microsoft Excel’s chart tooltips using a textbox and some VBA. As always, providing the Excel 2007/2010 workbook for free download.