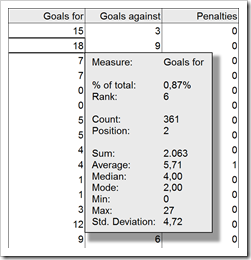
3 Examples of how to use an ActiveX Spreadsheet Control as a Tooltip on a Microsoft Excel Worksheet
 The recent post described how to use an ActiveX Spreadsheet Control as a tooltip on Excel worksheets. At first sight this seemed to be a nifty little idea to spice up tooltips on Microsoft Excel worksheets. In the meantime, however, I had to learn that there is a major pitfall:
The heart of the solution, the ActiveX Spreadsheet Control is part of the so called Office Web Components. So far, so good. The problem is that Microsoft does not ship the Office Web Components with Office 2007 and later anymore. In other words, in a clean, new Office 2007/2010 installation, the ActiveX Spreadsheet Control is not available anymore.
Microsoft still provides the Office Web Components for free download (Office 2003 Add-in: Office Web Components), but there is still a major drawback: if you want to use the described technique, you have to make sure that every user of your workbook either uses Excel 2003 or has the Office Web Components installed.
At the end of the previous post I announced a follow up article with more practical examples using the technique. Knowing now what I didn’t know before, I pondered if this article would still make sense. To cut a long story short, I finally decided to publish it despite the limitation described above. Maybe some of you will still find it interesting and useful.
Today’s post provides 3 different use cases of how to take advantage of the ActiveX Spreadsheet Control in a tooltip:
- a scrollable tooltip
- side calculations within a tooltip
- an improved version of the Summary Card tooltip
As always the articles provides all Excel workbooks for free download.

 Tooltips are a very helpful feature when exploring and investigating data. On charts and on plain data tables. When referring to tooltips, I am talking about additional details on the data currently selected or hovered over using the mouse. Tooltips could include other dimensions and measures, calculations or aggregated information like totals or averages.