Tag: microsoft excel

  • Interactive Drop Lines on Microsoft Excel Charts

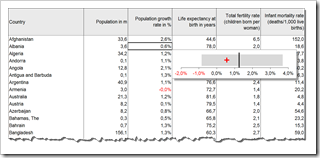
    Display drop lines to both axis of an Excel chart after clicking on a data point

    Ruler - Photographer Auntie P (flickr.com)The previous post (Tableau Quick Tip #4 – Drop Lines) discussed a great interactive feature for exploring large data sets on charts: the Drop Line.

    In fact I like this feature so much that I am not only using in Tableau. If the data is appropriate, I am also providing a similar feature on my Excel dashboards.

    You may ask:

    “Interactive Drop Lines in Excel Charts? Does Excel provide such a feature?”

    Not built-in, but with a few tweaks and a small piece of VBA code, you can easily get to interactive drop or reference lines in Microsoft Excel, too.

    Today’s post shows how to create interactive drop lines on Microsoft Excel charts for different chart types. As always, the article provides the Excel workbooks for free download.

    (more…)

  • Fast Choropleth Map with Enhanced Features

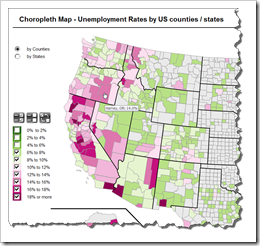
    Enhance a detailed Choropleth Map in Microsoft Excel with additional features

    Choropleth Map with enhanced featuresThe recent article Faster Choropleth Maps with Microsoft Excel provided a faster version of the VBA code to update a detailed Choropleth Map in Microsoft Excel.

    Leonid Koyfman, a faithful reader of Clearly and Simply liked this article. Leonid already contributed his invaluable ideas and insights here before (Excel Multiple Value Filters with Invert Selection). He had a couple of very interesting ideas for the fast Choropleth Map and he is kind enough to share them with us:


    1. Let the user filter the data by value bin and thereby highlight the bins of interest on the map
    2. Show tooltips when hovering over the map to display the name of the county and the unemployment rate in percent
    3. Let the user switch the level of detail: color the map by county or by state

    Today’s article describes Leonid’s enhancements and includes a link to the Excel workbook for free download.

    (more…)

  • Faster Choropleth Maps with Microsoft Excel

    An improved version of a Microsoft Excel Choropleth Map with a better performance for detailed maps

    Choropleth Map US Unemployment by CountyVery soon after starting this blog in 2009 I published a post with a set of Microsoft Excel Choropleth Map templates.  This post is still one of the most popular articles and downloads here.

    A lot of related posts followed and I am feeling very honored that my blogging colleague and France’s data visualization guru Bernard Lebelle of Impact Visuel used 2 of my maps published here on Clearly and Simply in his great new book “Convaincre avec des graphiques efficaces”. Bernard was kind enough to point his readers to my blog in the book. This is much appreciated. However, he should have heaped the praise on Tushar Mehta, who invented this technique. I only “stole” Tushar’s idea.

    Tushar’s approach works great and I know from comments and emails that a lot of my readers have used it with great success.

    There is only one minor drawback with Tushar’s approach: the performance decreases considerably when using it on a map with a lot of shapes, like the US by Counties.

    Today’s post tries to heal this. It discusses how to considerably improve the performance of a detailed map. The article describes the original approach, the optimization potential, the improved implementation and – as always – provides the Excel workbook for free download.

    (more…)

  • Display all Fields of a Row in large Excel Tables

    How to simplify the exploration of large Excel tables by showing the entire data record of the active row in additional text boxes

    ©dsdsdsdsdsds / flickr.comFrom time to time most of us have to work with very wide tables in Microsoft Excel. Tables with 30, 40 or even more columns, too wide to be visible on your screen at a glance.

    When investigating this data, it is often the case that you would like to see some values from columns that do not fit on the screen at the moment. E.g. you would like to see the sales and the profit at a glance, but the columns are so far from each other that they are not visible at the same time.

    Sounds familiar? What are you doing? Scrolling back and forth? Hiding and unhiding columns? A second window? Whatever technique you are using, I would assume you are sometimes wishing for something more convenient. A feature that shows the entire data record of the active row without scrolling or any other additional actions.

    Today’s post provides such a feature to improve the navigation within wide data tables. Two additional textboxes automatically show the values of the invisible columns for the active row. No additional clicks necessary. Simply navigate through your worksheet and click on any cell in your data table and the textboxes will automatically update without obscuring the active row.

    As usual, the article provides the Microsoft Excel workbook for free download.

    (more…)

  • Charts in Excel Table Tooltips

    How to display a Chart in the Tooltips on Microsoft Excel Tables visualizing the selected value within the context of the data distribution

    Charts in Excel Table TooltipsThe recent post Tooltips on Microsoft Excel Tables showed a way of how to create tooltips in Microsoft Excel tables displaying additional information on the selected cell / value and some aggregated measures for the data in the active column, like sum, average, standard deviation and others.

    If you are particularly interested in setting the selected value into the context of the distribution of the entire data, you may want to have a visualization in your tooltips. In other words a chart as a tooltip on a numeric data table. Sounds like turning the whole tooltip idea and concept upside down, doesn’t it? However, from time to time this can be a great alternative for adding more analytical power to your Excel tables.

    Today’s post provides a short tutorial how to create a tooltip displaying a chart. As usual, including the Microsoft Excel workbook for free download.

    (more…)