Tag: microsoft excel

  • Selecting and Highlighting Areas on Excel Charts

    Interactive Selecting and Highlighting Areas on an Map or an XY Scatter Chart in Microsoft Excel
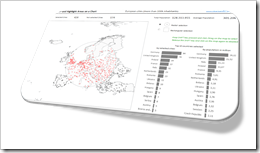
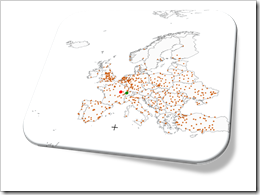
    Selecting and Highlighting on Excel ChartsThe previous post demonstrated an alternative technique to implement a direct interaction with an Excel chart using an ActiveX label control sitting on top of the chart. The example used in that post (a geography quiz) allowed a click on a map and evaluated the coordinates of the position the user clicked on.

    The technique, however, can also be used in many more cases. If you are working with an XY scatter chart and especially if you are working with a map, interactive selecting and highlighting a user-defined area of the chart can be a very helpful feature for exploring and analyzing the data.

    Tableau Software, for one, allows for different ways of selecting and highlighting areas. Microsoft Excel has no such features built in. With the technique described in the previous post and some additional VBA code, however, you can bluff almost the same functionality in Excel.

    Today’s article describes how to implement selecting and highlighting features on Excel charts. As always the example workbook and the VBA code is provided for free download.
    (more…)

  • Another Technique for Interactive Excel Charts

    Another technique to create interactive charts in Microsoft Excel using an ActiveX Label Control on top of the chart

    Where is it?Interactive features add a lot of analytical power to dashboards. If you want to create a professional analysis dashboard, interactivity is almost a must-have.
    Unfortunately, Excel does not provide built-in interactive features for charts. However, this doesn’t mean you can’t have interactivity on Excel dashboards.

    As always, VBA is the way to overcome Excel’s shortcomings.

    We already had a couple of articles providing workbooks with interactive features, like Bluffing Tableau Actions with Microsoft Excel, The Next Level of Interactive Microsoft Excel Dashboards, Microsoft Excel Site Catchment Analysis, Better Chart Tooltips with Microsoft Excel 2010.

    All of them were taking advantage of the chart object’s mouse event procedures. More precisely, they were based on the great code provided by Jon Peltier here: Get XY on any Chart.

    I recently discovered another technique to implement interactivity on Excel charts. Andy Pope uses an ActiveX label control on top of a chart to track and evaluate mouse positions. Unlike the chart object mouse events, Andy’s approach doesn’t require to activate the chart first.

    I “stole” Andy’s idea and used his technique to create a little interactive geography quiz in Excel: find European cities on a map. Today’s article describes the implementation of the workbook and the code and – as always – provides the Excel file for free download.

    (more…)

  • Drill Up and Down on Choropleth Maps in Excel

    Interactive drill up and down geographical hierarchies on a Choropleth Map in Microsoft Excel

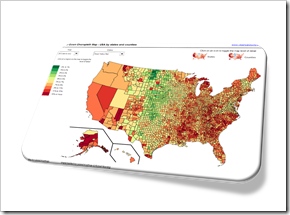
    Drill Down Choropleth Map USA

    The post Faster Choropleth Maps with Microsoft Excel provided a faster version to update a Choropleth Map in Microsoft Excel. The approach made it possible to use Choropleth Maps with several thousand regions on an interactive Microsoft Excel dashboard in production.

    This also opened up new possibilities to enhance the maps with additional features. Leonid Koyfman contributed a couple of great enhancements in the follow-up article Fast Choropleth Map with Enhanced Features like filtering the data by value bin, showing tooltips and letting the user decide whether the map shall be colored by state or by county.

    Very soon after this follow-up article was published, Leonid came up with another great idea. He suggested to take the user selection of how to color the map to the next level: let the user easily drill up and down the geographical hierarchy by simply clicking on the map. One click toggles from coloring the entire state to the counties in that state and vice versa. I have to admit, I am sitting on this nugget for one and half years already and never found (well, more precisely never took) the time to publish it. But finally the time has come. Here it is.

    Today’s article explains Leonid’s idea and implementation how to drill up and down geographical hierarchies on a Microsoft Excel Choropleth Map.

    The article includes two example workbooks for free download: the USA by states and counties and Germany by the two common ZIP-code levels PLZ2 and PLZ5 (first two digits of the ZIP-code and the entire five digits ZIP-code).

    (more…)

  • Interactive Tooltip Examples

    3 Examples of how to use an ActiveX Spreadsheet Control as a Tooltip on a Microsoft Excel Worksheet

    Prova Riporti - Photographer il Vanzo - tiny little pieces (flickr.com)The recent post described how to use an ActiveX Spreadsheet Control as a tooltip on Excel worksheets. At first sight this seemed to be a nifty little idea to spice up tooltips on Microsoft Excel worksheets. In the meantime, however, I had to learn that there is a major pitfall:

    The heart of the solution, the ActiveX Spreadsheet Control is part of the so called Office Web Components. So far, so good. The problem is that Microsoft does not ship the Office Web Components with Office 2007 and later anymore. In other words, in a clean, new Office 2007/2010 installation, the ActiveX Spreadsheet Control is not available anymore.

    Microsoft still provides the Office Web Components for free download (Office 2003 Add-in: Office Web Components), but there is still a major drawback: if you want to use the described technique, you have to make sure that every user of your workbook either uses Excel 2003 or has the Office Web Components installed.

    At the end of the previous post I announced a follow up article with more practical examples using the technique. Knowing now what I didn’t know before, I pondered if this article would still make sense. To cut a long story short, I finally decided to publish it despite the limitation described above. Maybe some of you will still find it interesting and useful.

    Today’s post provides 3 different use cases of how to take advantage of the ActiveX Spreadsheet Control in a tooltip:

    • a scrollable tooltip
    • side calculations within a tooltip
    • an improved version of the Summary Card tooltip

    As always the articles provides all Excel workbooks for free download.

    (more…)

  • Interactive Tooltips on Excel Worksheets

    The Next Level of Tooltips on Excel Worksheets: Taking Advantage of the ActiveX Spreadsheet Control

    Marchant mechanical calculating machine - Photographer: Ian's Shutter Habit (flickr.com)Tooltips are one of the most helpful features when prospecting large data sets.

    We already had a couple of articles talking about tooltips, on charts and on worksheets:

    Tooltips on Microsoft Excel Tables

    Charts in Excel Table Tooltips

    Display all Fields of a Row in large Excel Tables

    Better Chart Tooltips with Microsoft Excel 2010

    Today’s post is trying to take this to the next level: an interactive tooltip on a Microsoft Excel worksheet. You may ask:

    “What the heck is an interactive tooltip?”

    What I am thinking of is a tooltip enabling you not only to read additional information but also interact with it. E.g. copy data from the tooltip and paste it somewhere else, do side calculations based on the currently selected data, browse through a longer list of data in the tooltip, etc.

    Impossible? No it isn’t. Microsoft provides a very useful ActiveX control which enables us to do exactly this: the Microsoft Office Spreadsheet Control. Today’s post shows how to take advantage of this ActiveX control in order to provide an interactive tooltip on Excel worksheets – as always including the Excel workbook for free download.

    (more…)