Tag: highlighting across Excel charts

  • Select and Highlight across an Excel Dashboard

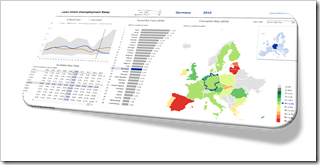
    Interactive Excel Dashboard visualizing unemployment rates in the EU. Select a country, filter by age group and gender, and see the selection highlighted across all visuals on the dashboard

    1,176 words, ~6 minutes read
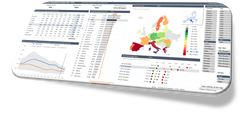
    Excel_EU_unemployment_rates_dashboard10 years ago, I published a post demonstrating how to highlight one selected item across all charts and views on an interactive Excel Dashboard:

    Highlighting on Excel Dashboards

    Unlike most of my other publications here, that post actually did make some friends.

    And even more, it won a real fan: my good friend and Microsoft Excel MVP Carlos Barboza (Carlos’ LinkedIn Profile, Carlos’ blog: Spilled Graphics) liked this workbook so much that he even included it in some of his presentations, e.g. his great speech on the Global Excel Summit in 2024.

    Recently Carlos asked me, if I could provide a version with an updated data source. Of course I can. And while I was at it, I also made a couple of (hopefully helpful) changes.

    Today’s article provides this updated version of my European Union Unemployment Rates Dashboard from 2015. It also briefly discusses why interactive dashboards in Excel are still a viable option, even nowadays with Tableau and Power BI.
    (more…)

  • Highlight Actions in Microsoft Excel with Multiselecting

    How to implement Highlight Actions in Microsoft Excel with the option to select more than one category (Multiselecting)

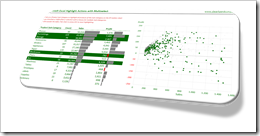
    Multiselect Highlight Actions Excel IntroClearly and Simply proudly presents another guest article: Leonid Koyfman, long-time contributor to this blog, enhances the approach to Highlight Actions in Microsoft Excel with the option to select more than one category. Leonid developed an impressively simple and elegant technique. Enjoy.

    The recent post Highlight Actions in Microsoft Excel provided a mechanism to replicate Tableau’s highlight actions in Microsoft Excel and focused on the specific use case when a selection of a row within the data table, or a bar of the “bar charts”, automatically highlighted related products on the XY scatter chart and shaded off all other data points.

    Getting closer to what can be done in Tableau, the suggested approach lacks an important Tableau functionality: multi-selection. In the Highlight Action Example in Tableau we are not limited to a single item selection. We can select multiple Sub-Categories with a mouse or CTRL-Click and this action will highlight the corresponding data points on the XY scatter chart.

    Today’s post includes a set of techniques and tricks to extend the dashboard presented in Highlight Actions in Microsoft Excel to mimic Tableau’s multiselecting feature.

    (more…)

  • Highlight Actions in Microsoft Excel

    How to implement a specific Highlight Action Use Case in Microsoft Excel

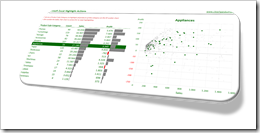
    Highlight Actions in ExcelHighlight Actions in Tableau allow you to visualize all data points related to a user-selection across different views on a dashboard by coloring the relevant marks and shading off all others.

    Highlight Actions are a great feature for interactive data exploration in general, but there is one specific use case where highlighting is extremely useful:

    Imagine you have a data set with a hierarchy of dimensions like Product Category|Product Sub-Category|Product, State|County or something similar. If this is the case, chances are that the dashboard will show consolidated results per e.g. Product Sub-Category in a table or Bar Chart and a distribution of all Products by two measures (e.g. Sales and Profit) on an XY Scatter Chart. With a Highlighting Action in place, you can easily click on one Sub-Category in the first view and immediately see all related data (i.e. all Products belonging to this Sub-Category) on the XY Scatter Chart. Highlight Actions are preferable to Filter Actions in this case, because they show the  members of the selected category within the context of the distribution of all data points.

    Creating Highlight Actions in Tableau is a piece of cake. A few mouse clicks and you are good to go. But what if you want to have a similar feature on your Excel dashboard? Unfortunately, Excel does not provide actions across views natively, but with a few lines of VBA code and a simple charting trick, you can replicate Tableau’s Highlight Actions in Microsoft Excel, too.

    We already had a couple of posts here providing similar functionalities with a comparable approach:

    Bluffing Tableau Actions with Microsoft Excel

    Highlighting on Excel Dashboards

      Mouse Driven Actions on Excel Dashboards

    Today’s post is along the same lines, but focusses on the specific use case described above. It explains how to create this particular Highlight Action in Excel and provides an example workbook for free download.

    (more…)

  • Highlighting on Excel Dashboards

    Highlight one selected item across all charts and views of an Excel Dashboard: an example and the how-to

    Dashboard EU Unemployment RatesVery often, a dimension is displayed on more than one view of a dashboard.

    Let’s say you want to analyze data of the European Union. Chances are that you will have the dimension “member state” on more than one of your charts.

    If you pull these charts together into one dashboard, highlighting a selected member state across all charts is very helpful to explore and analyze the data. It supports the user to easily focus on the selected state and to identify its position in the context of all members at a glance.

    Highlighting is the very simple act of selecting one item out of many (by e.g. clicking) and automatically seeing this item emphasized in all views across the entire dashboard. This is a very effective and user-friendly visualization technique and should be available on every interactive dashboard.

    Today’s post shows how to implement highlighting on an Excel dashboard. As always, including the Excel workbook for free download.

    (more…)