A Carousel of Charts as a visual and interactive Navigation Control for Microsoft Excel Workbooks
726 words, ~4 minutes read
 If your Excel workbook has many output worksheets, you should provide your users with an option to facilitate the navigation within the model.
Sure, the user always has the option to right click on the arrows left to the first tab and select any worksheet from there, but this requires that she/he exactly knows where to find what.
It is best practice to give the users guidance regarding the content of your model and to enable them to easily navigate to the sheets they are most interested in. Usually, you insert an extra worksheet containing a list of all tabs with hyperlinks or buttons to quickly navigate to those sheets.
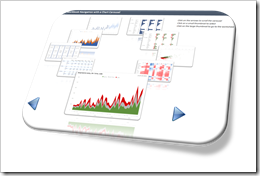
You are interested in something more visually compelling? If so, you came to the right place. Today’s article provides a visual workbook navigation control with a chart carousel dynamically displaying the content of the relevant sheets. The user can easily browse through all views, select the desired one and get to the view with one mouse click. As always, the post comes with an example workbook for free download.
