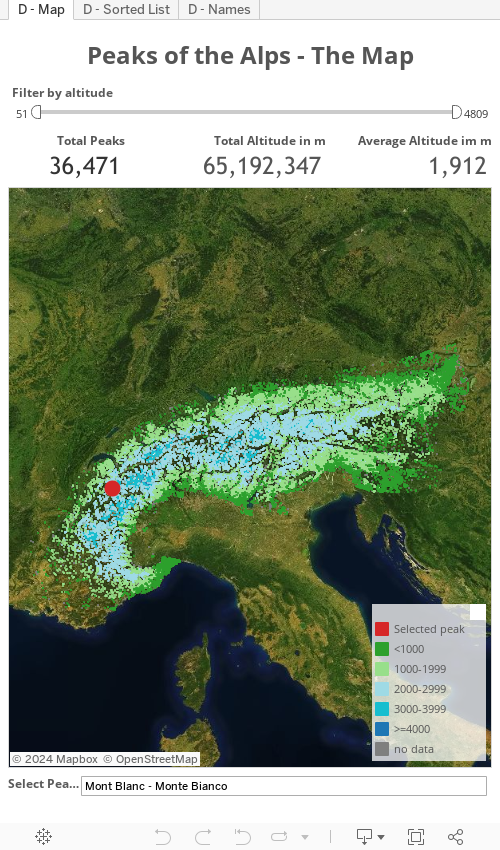
A Tableau visualization of all peaks of the alps including the option to find and highlight one peak or to select one by clicking on the map
The FrankensTeam runs one of the most interesting and resourceful websites about advanced charting techniques in Microsoft Excel (E90E50fx). In March 2015 the team met in person for the very first time in Milan. To celebrate this, they published an Excel workbook with a visualization of all peaks of the Alps: Meeting in Milano, trip to the Alps and an Excel chart.
 Having been a mountaineer in my younger days, I was intrigued with this idea. I asked them for permission to use the idea and data for a replica of their visualization in Tableau. They kindly agreed.
I am deeply ashamed to admit that I am sitting on the Tableau replica for a couple of years already, but never published it. Until today.
This post provides and explains a Tableau Public workbook showing all peaks of the alps with all the amazing interactive features of Tableau.
The Idea by The FrankensTeam
First things first. Here is the inspiration to this article: the visualization of the peaks of the Alps in Excel published by the FrankensTeam:
 It is actually a pretty simple visualization, at least compared to the other charts provided on E90E50charts – Excel Charts gallery. It is a standard XY Scatter Chart in Excel. However, they used named formulas as the sources of the data series. A very efficient technique, especially when plotting large data sets on an Excel chart. If you are not familiar with this, you should definitely check this out.
The Data
The FrankensTeam used a data set provided for download on ViewFinderPanoramas.
So did I, when I started working on the Tableau version. Just recently, though, I discovered another great source for the peaks of the Alps: Stefan V. Baumgartner’s Blog.ZirbitzKogel.at (in German). Stefan created his own register of all peaks of the Alps based on the open source geodatabase OpenStreetMap as a Google Earth KMZ file.
Stefan is kind enough to share his work on his blog. I downloaded the KMZ-file, extracted the most basic information (name of the peak, latitude, longitude and altitude), put it into an Excel workbook and I was good to go.
The Peaks of the Alps in Tableau
Without further ado, here it is: the visualization of more than 36,000 peaks of the Alps in Tableau Public:
The Dashboards and their Interactive Features
The visualization consists of three dashboards:
1. The Map
What did you expect? It is geospatial data. Of course, there is a map.
The peaks are displayed as circle markers on the map and color coded by altitude bins. You can filter the view by altitude and will see the filtered peaks on the map and the count of peaks, the sum of altitudes and the average altitude (arithmetic mean) above the view.
All the great map features of Tableau are available of course, like zoom, pan, rectangular, radial and lasso selection, etc. It goes without saying that you also see tooltips with name and altitude of the peak when hovering over the map with the mouse.
Last but not least you can select one peak either
- by typing a name into the search bar at the bottom of the dashboard (search as you type) or
- by simply clicking on a peak on the map
The selected mountain will be highlighted in red and with a larger marker.
2. Sorted List
A very basic view: a color coded bar chart sorted descending by altitude, filterable by altitude. Not much to explain here, I guess.
3. Names
Again a descending sorted bar chart, but this time visualizing the count, how often this peak name exists in the data. You can filter the view by count and also see the names visualized in a Word Cloud beneath the bar chart.
The Implementation
Most parts of these views and features are implemented using standard Tableau functionality. Nothing to write home about.
Maybe you are not familiar with the Word Cloud on dashboard [Names], because this is more an infographic visualization than one of the business chart types you are mainly using. If you are interested in how to create a Word Cloud in Tableau, have a look at this article: Word Clouds with Tableau.
The only feature which is worth taking a closer look, is the option to select and highlight one peak by directly clicking on the map or by typing in a peak name in the search box at the bottom.
Here is a short description how this is done:
Step 1: Parameter
Insert a parameter called e.g. [Selected Peak]. Define the data type as string and select in List of Values the parameter to be updated with the values from the field [Name] when the workbook is opened:
 Step 2: Calculated Field [Color Dimension]
Insert a Calculated Field called e.g. [Color Dimension] to return either the text “Selected peak” if the name equals the name of the peak selected by the parameter or a text specifying the altitude bin:
 Step 3: Calculated Field [Size Dimension]
Insert another Calculated Field called e.g. [Size Dimension] to return a larger value (2) for the selected peak than for all others (1):
 Step 4: Use the Calculated Fields on the Shelfs:
You guessed it already, didn’t you? Drag [Color Dimension] to the Colour Shelf and [Size Dimension] to the Size Shelf:
 Adjust the colours and size as you like. You certainly know how to do that.
Step 5: The Parameter Action
So much for the preparation. Now, add a Parameter Action to the dashboard, activate “Select” for “Run action on” and pick [Selected Peak] as the target parameter:
 And that’s it. 5 steps, less than 10 minutes of work and you have a feature to let the user select a peak by clicking on the map or search as you type and highlight the selection on the map with a larger red marker.
Acknowledgements
Many thanks go again to the FrankensTeam for the idea and their permission to create a replica of their Excel workbook in Tableau. I would also like to thank again Roberto, Kris and Gábor for all their fabulous Excel charts published on E90E50charts – Excel Charts Gallery. Your site is a treasure chest for anyone interested in advanced, sophisticated Excel charts.
Last, but not least, many thanks to Stefan Baumgartner for publishing and sharing his peak list of the Alps over at Blog.ZirbitzKogel.at. Thanks, Stefan.
Stay tuned.
Leave a Reply