How to create a Microsoft Excel Pivot Table lookalike Crosstab with Texts in the Value Area using Array Formulas

Pivot Tables are probably the most powerful built-in data analysis feature of Microsoft Excel. With only a couple of mouse clicks, you can summarize and analyze your data from different perspectives. Well, I do not want to carry coals to Newcastle. I am sure you know all about the power of Pivot Tables.
However, there is one thing you can’t do with Pivot Tables: create a cross-tabular view with texts in the value area.
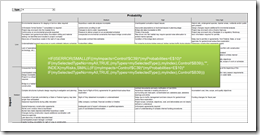
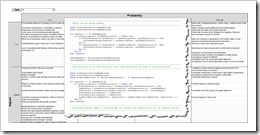
A real-life example should help to understand what I am talking about: Let’s assume you are managing a big project and you have a list of all existing project risks. The table includes the descriptions of the risks and you classified each of them using different categories like the risk impact (high, medium, low), the probability (very high, high, medium, low) and maybe the type of the risk, the subproject or the name of the responsible project member. If it is a large project with a considerable number of risks, you may be interested in a cross-tabular view of your risk list with e.g. the impact in the rows, the probabilities in the columns and maybe the option to filter the view by a third category like the risk type.
At first sight this looks like the perfect use case for Pivot Tables, but a Pivot Table aggregates data, i.e. Pivot Tables always have numerical results in the value area. In other words, all you can show in the value area is the count of risks for each combination. But what if the count is not enough and you prefer seeing the description of all risks for all combinations of impact and probability?
Today’s post is the first of two articles showing how to emulate a Pivot Table with texts in the value area. There are several ways of doing this, but there are 2 general approaches: with or without VBA. Today's article demonstrates a way to achieve this with Excel’s array formulas only. The next article will provide a VBA based solution which overcomes most of the weaknesses of today’s formula based approach.
As usual the post includes an example Excel workbook for free download.
(more…)
 The recent post showed a way how to create a Pivot Table lookalike crosstab with texts in the value area.