Tag: choropleth maps with excel

  • Animated Maps in Microsoft Excel

    How to create an animated Choropleth Map (aka Heat Map, Filled Map, Thematic Map or Statistical Map) in Microsoft Excel

    1.006 words, ~5 minutes read

    In one of the recent articles (All Peaks of the Alps visualized in Excel), I tried to show how to combine different advanced techniques in Microsoft Excel (posted here or elsewhere) to create highly interactive Excel dashboards.

    I will tell you no lies: that one was a washout. The interest in that post and workbook was next to nothing. Now, you certainly expect I would have learned my lesson and try something else. I did learn something, but the stubborn old man I am, I can’t let it go yet. Thus, I decided to give the idea another shot.

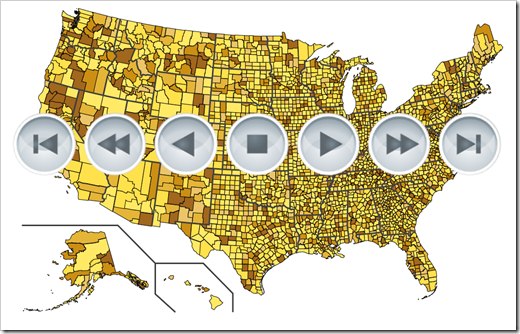
    Animated Choropleth or Heat Maps have become quite popular, especially in the past few weeks. So, there is nothing more obvious than providing a template with an animated Choropleth Map in Excel, is it?

    Animated Maps in Microsoft Excel Intro

    Today’s post will briefly explain how to combine two advanced Excel techniques which have already been published here: a Choropleth Map and the animation of visualizations in Excel.

    As always, the article comes with the workbooks for free download: an animated map of Germany by districts (Kreise und kreisfreie Städte) and one of the United States by counties.

    (more…)

  • Optimized Choropleth Maps in Microsoft Excel

    How to create optimized Choropleth Maps in Excel with a higher resolution and without distortions using Excel 365

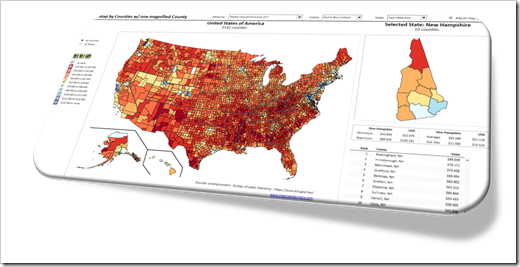
    Inspired by an idea of my internet friend and highly esteemed colleague Leonid Koyfman, the post US Choropleth Map by County per State – a 4th Option described and provided an Excel workbook with a Choropleth Map of the United States including a second map showing a magnified view of one selected state.

    Optimized Chroropleth Maps in Excel (Intro)The code and technique itself worked fine.

    However, there was one major disadvantage: during the process of creating the map in Excel, the shapes were slightly distorted. The zoomed map of one state still looked good for e.g. Texas or California, but definitely not for smaller states like Rhode Island or Connecticut.

    Today’s post provides a solution to overcome this issue: a way to create a Choropleth Map in Excel without distortions, displaying all counties accurately, no matter at which zoom level. As always, an example workbook is provided for free download.

    (more…)

  • US Choropleth Map by County per State – a 4th Option

    Another option to display a Choropleth Map of the United States by County for one user-selected state in Microsoft Excel

    The previous post presented three different options to implement a US Choropleth Map by County per State in Microsoft Excel. One approach showed the entire map of the United States and highlighted the selected state (option 2), whereas option 3 filtered the data and only plotted the counties of the selected state.

    It was again Leonid Koyfman (who else?), who provided me with an interesting idea for another alternative: Leonid suggested in this comment to combine options 2 and 3 and show both maps in one view. This requires more real estate on the dashboard, but it also combines the advantages of both approaches: it provides a zoomed map of the selected state and keeps the context of this state on the map of the entire USA.

    Since the technique will certainly be most useful on a dashboard showing more than just the maps, I created an example visualization with two additional views:
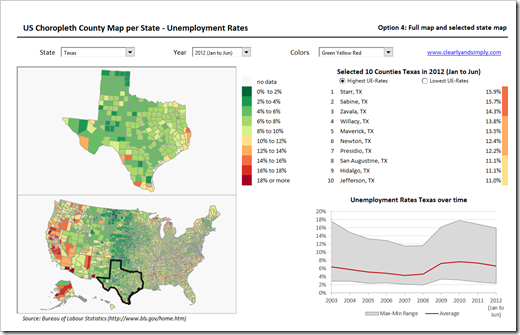
    US Choropleth Map by County per State Dashboard - click to enlarge

    • On the left side of the dashboard the two maps (zoomed selected state and USA) are displayed
    • At top right of the visualization a table lists 10 selected counties of the current state: the 10 counties with the highest or lowest unemployment rates. A small new VBA routine assigns the according bin color to each of the 10 counties in the narrow column right to the table
    • The band chart at bottom right visualizes minimum, maximum and (unweighted) average of unemployment rates of all counties in the selected state over time

    This is just one example how the technique of visualizing maps for a user selected state could be integrated in a more complex dashboard.

    If you want to use this on your own dashboard, you may want to play around with the size of the maps and where they are located. Size and position of the zoomed state map are defined by the named range “myMapView”. You can adjust the zoomed map by simply changing the cell reference of this name. As for the map of the USA, you have to group all shapes of the US map first, then resize and reposition this group and finally ungroup it again.

    The major disadvantage remains, though: the zoomed map of the selected state makes the distortions visible. These distortions are inevitable in the process of converting SVG-files to freeform shapes in Excel. Well, at least I couldn’t find a way to avoid them. The problem depends on the size of the selected state: Texas and California, for instance, still look good as a zoomed map. Rhode Island and Connecticut definitely don’t. A crucial downside, no doubt about it. Unfortunately I do not have a solution for this. A map would be needed which will not be distorted in the ungrouping process, but I couldn’t find a better map than the one used here.

    If you are interested, here is the link to download the zipped Excel workbook:

    Download US Choropleth County Map per State (zipped Excel workbook, 2.4 MB)

    Many thanks go to Leonid for the idea.

    Stay tuned.
  • US Choropleth Map by County per State

    How to display a Choropleth Map of the United States by County for one user-selected state

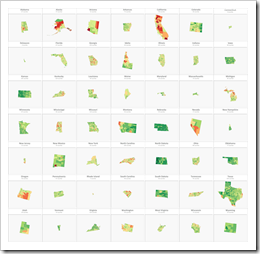
    Choropleth US Map by County per State (Intro)If you are a regular reader of this blog, you certainly know that I am into geographical data visualization. Just click on “Choropleth Maps” in the Categories roll on the right side of the blog and you will see that we already had 18 (!) posts in this category. Some of them discussing maps in Tableau, but most of them dealing with the question how to implement Choropleth Maps or Cartograms in Microsoft Excel.
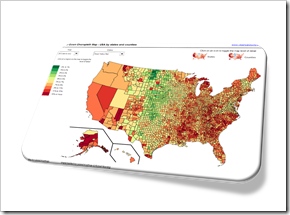
    I thought I would be through with this topic. I really did. However, I recently noticed that there is one common use case for Choropleth Maps in Excel I never wrote about: visualizing one user-selected region of a bigger map. Imagine you have geographical data with a hierarchy, e.g. USA by state and county (to state the obvious for the majority of my readers). It may well be that one of your dashboards is focused on displaying views for one selected state only.

    Now, what if one of your views shall be a Choropleth Map? How can you show only the selected part of a map on your dashboard?

    Today’s post describes three different options how to do this. As always, the example Excel workbooks are provided for free download without any password protection.

    (more…)

  • Drill Up and Down on Choropleth Maps in Excel

    Interactive drill up and down geographical hierarchies on a Choropleth Map in Microsoft Excel

    Drill Down Choropleth Map USA

    The post Faster Choropleth Maps with Microsoft Excel provided a faster version to update a Choropleth Map in Microsoft Excel. The approach made it possible to use Choropleth Maps with several thousand regions on an interactive Microsoft Excel dashboard in production.

    This also opened up new possibilities to enhance the maps with additional features. Leonid Koyfman contributed a couple of great enhancements in the follow-up article Fast Choropleth Map with Enhanced Features like filtering the data by value bin, showing tooltips and letting the user decide whether the map shall be colored by state or by county.

    Very soon after this follow-up article was published, Leonid came up with another great idea. He suggested to take the user selection of how to color the map to the next level: let the user easily drill up and down the geographical hierarchy by simply clicking on the map. One click toggles from coloring the entire state to the counties in that state and vice versa. I have to admit, I am sitting on this nugget for one and half years already and never found (well, more precisely never took) the time to publish it. But finally the time has come. Here it is.

    Today’s article explains Leonid’s idea and implementation how to drill up and down geographical hierarchies on a Microsoft Excel Choropleth Map.

    The article includes two example workbooks for free download: the USA by states and counties and Germany by the two common ZIP-code levels PLZ2 and PLZ5 (first two digits of the ZIP-code and the entire five digits ZIP-code).

    (more…)