Tag: bluffing tableau with excel

  • Highlight Actions in Microsoft Excel with Multiselecting

    How to implement Highlight Actions in Microsoft Excel with the option to select more than one category (Multiselecting)
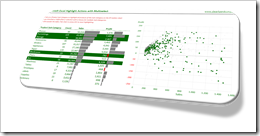
    Multiselect Highlight Actions Excel IntroClearly and Simply proudly presents another guest article: Leonid Koyfman, long-time contributor to this blog, enhances the approach to Highlight Actions in Microsoft Excel with the option to select more than one category. Leonid developed an impressively simple and elegant technique. Enjoy.

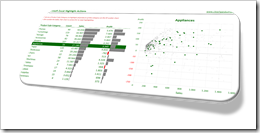
    The recent post Highlight Actions in Microsoft Excel provided a mechanism to replicate Tableau’s highlight actions in Microsoft Excel and focused on the specific use case when a selection of a row within the data table, or a bar of the “bar charts”, automatically highlighted related products on the XY scatter chart and shaded off all other data points.

    Getting closer to what can be done in Tableau, the suggested approach lacks an important Tableau functionality: multi-selection. In the Highlight Action Example in Tableau we are not limited to a single item selection. We can select multiple Sub-Categories with a mouse or CTRL-Click and this action will highlight the corresponding data points on the XY scatter chart.

    Today’s post includes a set of techniques and tricks to extend the dashboard presented in Highlight Actions in Microsoft Excel to mimic Tableau’s multiselecting feature.
    (more…)

  • Highlight Actions in Microsoft Excel

    How to implement a specific Highlight Action Use Case in Microsoft Excel

    Highlight Actions in ExcelHighlight Actions in Tableau allow you to visualize all data points related to a user-selection across different views on a dashboard by coloring the relevant marks and shading off all others.

    Highlight Actions are a great feature for interactive data exploration in general, but there is one specific use case where highlighting is extremely useful:

    Imagine you have a data set with a hierarchy of dimensions like Product Category|Product Sub-Category|Product, State|County or something similar. If this is the case, chances are that the dashboard will show consolidated results per e.g. Product Sub-Category in a table or Bar Chart and a distribution of all Products by two measures (e.g. Sales and Profit) on an XY Scatter Chart. With a Highlighting Action in place, you can easily click on one Sub-Category in the first view and immediately see all related data (i.e. all Products belonging to this Sub-Category) on the XY Scatter Chart. Highlight Actions are preferable to Filter Actions in this case, because they show the  members of the selected category within the context of the distribution of all data points.

    Creating Highlight Actions in Tableau is a piece of cake. A few mouse clicks and you are good to go. But what if you want to have a similar feature on your Excel dashboard? Unfortunately, Excel does not provide actions across views natively, but with a few lines of VBA code and a simple charting trick, you can replicate Tableau’s Highlight Actions in Microsoft Excel, too.

    We already had a couple of posts here providing similar functionalities with a comparable approach:

    Bluffing Tableau Actions with Microsoft Excel

    Highlighting on Excel Dashboards

      Mouse Driven Actions on Excel Dashboards

    Today’s post is along the same lines, but focusses on the specific use case described above. It explains how to create this particular Highlight Action in Excel and provides an example workbook for free download.

    (more…)

  • Bruce Springsteen Discography in Excel

    A Microsoft Excel Replica of the Tableau Infographic on Bruce Springsteen’s Discography

    Bruce Springsteen at the Austin Music Awards - Photographer: Charlie Llewellin (flickr.com)The recent post presented a Tableau Infographic on the Discography of Bruce Springsteen’s Studio Albums.

    Tableau apparently liked my Infographic and selected it as the Viz of the Day for June 25, 2013 and even incorporated it in the Tableau Public Gallery. I am feeling honored. Thanks, folks!

    I originally planned to directly continue with a follow-up post about how to create and when to use Word Clouds in Tableau.

    On second thought I decided to postpone this follow-up article. I haven’t published anything for more than 6 months and I had a strong feeling I should quickly do something for those of you primarily interested in Microsoft Excel.

    So, if you are waiting for the article on Word Clouds in Tableau, please bear with me. The post will come soon.

    Those of you interested in Excel: this is for you. What would have been more obvious than publishing a replica of the Bruce Springsteen Discography in Microsoft Excel? It goes without saying that the Excel workbook mimics the most interesting interactive features of the Tableau original. As always the article provides the Excel workbook for free download.

    (more…)

  • Bluffing Tableau Actions with Microsoft Excel

    Selected techniques to emulate a Tableau lookalike dashboard using Microsoft Excel, including some interactive features similar to Tableau Actions

    Actions - Clapperboard ExcelThe recent post described the power of Tableau Actions. Tableau actions allow you to add context and user-defined interactivity features across your workbook. If the user clicks on one of your visualizations, Actions give you full control over what should happen on other worksheets or visualizations. Setting up a Tableau dashboard with various actions like filtering, highlighting and linking to web pages is a piece of cake.

    How about Microsoft Excel? Is it possible to implement a similar interactivity on a Microsoft Excel dashboard? Yes it is.

    Today’s post describes a set of techniques and tricks to build a replica of the Tableau 50 most prominent summits on earth dashboard using Microsoft Excel. As always, including the workbook for free download.

    (more…)