Tag: animation chart

  • Animated Races of the 4 Big Football Leagues

    Complementing the previous post: Animated Races of the 4 big Football Leagues in Europe: Premier League, Serie A, La Liga and Bundesliga

    297 words, ~1.5 minutes read

    4 League Logos

    The previous article showed an an Alternative to the Bar Chart Race in Microsoft Excel.

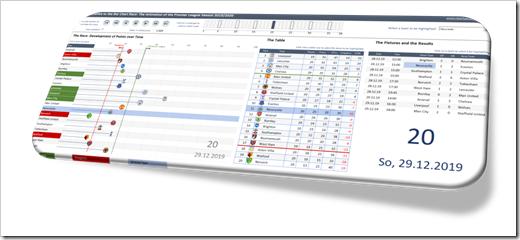
    As an example, the workbook visualized the results of the English Premier League of this season (2019/2020) in an animated chart.

    A few people apparently liked the visualization. I received a couple of emails and LinkedIn messages asking, if I could also provide the same workbook for other football leagues.

    No sweat.

    Here are the according Excel workbooks for Italy’s Serie A, Spain’s La Liga and the German Bundesliga:

    Download Animated Serie A 2019/2020 (zipped Excel workbook, 1.4MB)

    Download Animated La Liga 2019/2020 (zipped Excel workbook, 2.6MB)

    Download Animated Bundesliga 2019/2020 (zipped Excel workbook, 1.6MB)

    And for the sake of completeness, here is the link to the Premier League version again:

    Download Animated Premier League 2019/2020 (zipped Excel workbook, 2.8MB)

    Please note that

    • Except for the Bundesliga, all leagues are still ongoing. The data in the workbook contains only the results up to July 9, 2020. If you want to have a full view of the season, you will have to complete the results on the worksheet [Data] during the upcoming weeks. The fixtures of the remaining matchdays are there already, but the results are missing
    • The workbook for Italy’s Serie A contains an inaccuracy. Just like in the other three leagues, teams tied in points are ranked by Goal Difference first and Goals scored second. This is not correct for Italy: in Serie A, the tie breaker are the matches of these two teams (head-to-head records). Thus, the final table shown in the workbook might not be the official / correct one

    Stay tuned.
  • An Alternative to the Bar Chart Race

    An alternative solution to the controversial animated Bar Chart Races in Microsoft Excel

    1,276 words, ~ 6.5 minutes read

    Alternative to the Bar Chart Race - Intro

    The other day, I watched an as interesting as entertaining dispute between Andy Kirk and Andy Cotgreave about the popular Bar Chart Races: Data Viz Debate: Is the bar chart race more than just a gimmick?

    Although I truly admire Andy Kirk’s work, I am with Andy Cotgreave, here. I wouldn’t go so far to call them the “fidget spinners of data visualization”, but I find them hard to follow, especially when the speed of the animation is too fast.

    Last week, Philip Treacy of MyOnlineTrainingHub published a post and a workbook, how to do a Bar Chart Race in Microsoft Excel. Philip visualized the 2019/2020 Premier League results in an animated Bar Chart. I am a big fan of Mynda and Philip’s MyOnlineTrainingHub, which is definitely one of the best Excel websites worldwide.

    This made me think. Although I love Philip’s work, I am not a fan of the Bar Chart Race. So, how would I approach this? Today’s post provides my solution of an alternative for animated Bar Charts. As always, the post comes with the Excel workbook for free download.

    (more…)

  • Gapminder Replica in Microsoft Excel

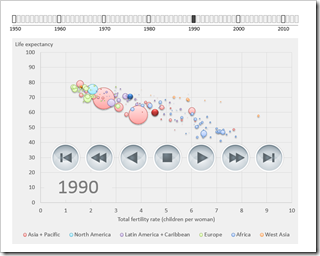
    A Gapminder-lookalike animated chart in Microsoft Excel, based on the generic Motion Chart Excel Template

    Gapminder Replica in Microsoft Excel

    The recent article Motion Chart Excel Template provided a generic template for a motion or animation chart in Microsoft Excel. The examples in that post visualized episodes of the Italian cartoon series La Linea (La Linea article on Wikipedia).

    Today’s article will put the motion chart template to a more serious, business like use: a Gapminder replica in Microsoft Excel.

    For those of you who do not know Gapminder: Gapminder is a data visualization software to animate statistics. It was originally developed by Prof. Hans Rosling and his team and Prof. Rosling presented it in this famous TED talk:

    Hans Rosling shows the best stats you have ever seen

    Today’s article rebuilds this data visualization and animation in Microsoft Excel using exactly the same metrics. As always, the Microsoft Excel workbook is provided for free download.

    (more…)

  • Motion Chart Excel Template

    A generic template to create Motion Charts in Microsoft Excel and 2 examples to animate La Linea episodes in Excel

    La Linea #7 - Photographer: Jimmy Fllnk (flickr.com)A preliminary note

    In the previous article I published my three entries for Tableau’s current “Viz as Art” contest.

    With pride and humility I announce that one of my entries (my replica of Curtis Steiner’s 1,000 blocks) made the cut and is among the 10 finalists:

    Destination Data—Viz as Art contest finalists & voting

    The voting is open now through Friday, August 29, 2014, 5pm (PST) and takes place on Twitter. So, if you have a Twitter account, please have a look and vote with a tweet.

    To be crystal clear: I am not asking you to necessarily vote for my entry. Have a look, see for yourself and decide which entry you like most. It goes without saying that it is your decision who to vote for, but please do vote. Thank you!

    So much for the preliminary note, now on to today’s content:

    As mentioned above, I submitted three entries, but truth be told, I had a favorite child: the La Linea workbook. Maybe because it was the only one I haven’t published before, maybe because it reminds me of my childhood, I don’t know.

    Anyway. As soon as you have your data, it is very easy to create this animation in Tableau. However, this kind of motion chart is possible in Microsoft Excel, too. So I thought it might be interesting to publish an Excel replica of my La Linea Tableau workbook.

    Today’s post provides an Excel version of my La Linea Tableau workbook, a generic template to create motion charts in Excel and also an Excel workbook to animate a whole episode of La Linea. Of course, all workbooks are provided for free download.

    (more…)