• Extract Custom Shapes from a Tableau Workbook

    How to extract the Custom Shape Images embedded in a Tableau Workbook

    Enigma Inside - Photographer: Anthony Catalano (flickr.com)In Tableau Software you can use the Shape Mark property to encode data in a view by different shapes. You can either use Tableau’s default shapes (circles, squares, crosses, etc.) or so called Custom Shapes. Each Tableau installation comes with a set of Custom Shape palettes like arrows, bars, currency and gender symbols and others. Have a look into the Shapes folder of your Tableau Repository to see what is already there.

    On top of that, you can also add your own Custom Shape Palette to this collection. Simply create a new folder in the Shapes folder of your Tableau Repository and copy the image files you want to use as shapes (.png, .gif, .jpg, .bmp or.tiff, but no .emf) into this folder. If you then assign shapes in the Edit Shape dialogue in Tableau, this folder automatically appears in the Select Shape Palette drop down and your images can be used to encode the data.

    Tableau stores the used Custom Shapes in the .twb file, to make sure the workbook is fully functional on every computer, i.e. also on installations which do not have the Custom Shapes in the Tableau Repository.

    So much for the background. And so far, so good.

    Now, imagine you have a Tableau workbook using Custom Shapes, but you do not have the image files in your Tableau Repository, because you are working with a new or different computer, you received the workbook from a colleague or downloaded it from Tableau Public.

    What if you want to reuse the Custom Shapes in another workbook?

    Is there an option to extract the Custom Shape image files from a Tableau workbook?

    Not built-in, but there are two existing workarounds provided by Matt York in the Tableau Forum and on the Tableau Public Blog. Although Matt’s solutions are very smart and easy to use, I decided to add my 2 cents with a third workaround.

    Today’s post includes the links to Matt York’s Tableau Shape Extractor workarounds and describes a third option of how to do the same with a Microsoft Excel workbook. As always, the article provides the Extract Custom Shape Excel tool for free download.

    (more…)

  • Bruce Springsteen Discography in Excel

    A Microsoft Excel Replica of the Tableau Infographic on Bruce Springsteen’s Discography

    Bruce Springsteen at the Austin Music Awards - Photographer: Charlie Llewellin (flickr.com)The recent post presented a Tableau Infographic on the Discography of Bruce Springsteen’s Studio Albums.

    Tableau apparently liked my Infographic and selected it as the Viz of the Day for June 25, 2013 and even incorporated it in the Tableau Public Gallery. I am feeling honored. Thanks, folks!

    I originally planned to directly continue with a follow-up post about how to create and when to use Word Clouds in Tableau.

    On second thought I decided to postpone this follow-up article. I haven’t published anything for more than 6 months and I had a strong feeling I should quickly do something for those of you primarily interested in Microsoft Excel.

    So, if you are waiting for the article on Word Clouds in Tableau, please bear with me. The post will come soon.

    Those of you interested in Excel: this is for you. What would have been more obvious than publishing a replica of the Bruce Springsteen Discography in Microsoft Excel? It goes without saying that the Excel workbook mimics the most interesting interactive features of the Tableau original. As always the article provides the Excel workbook for free download.

    (more…)

  • Bruce Springsteen Discography – An Infographic

    A Tableau Infographic – The Discography of Bruce Springsteen’s Studio Albums

    Bruce Springsteen live in Munich 2009 - Photographer: Lord_Henry (flickr.com)After six months without any new blog posts (please accept my apologies) I felt totally out of practice. Hence, I thought starting with a fun post and an infographic would make my comeback to blogging easier than an article on a more serious data analysis or data visualization topic.

    4 weeks ago I received an email from a guy (pen name: Chorizo Garbanzo) who runs together with 2 friends a music blog and podcast called Trust The Wizards.

    Chorizo stumbled across a post I have written back in November 2010: Wordle Tag Clouds in Microsoft Excel, where I used the lyrics of Bruce Springsteen songs to demonstrate how to embed Wordle in a Microsoft Excel workbook. Chorizo took the lyrics out of this workbook and created a blog post showing screenshots of Wordle Clouds for a selection of Springsteen albums: Trust The Wizards – Bruce Springsteen Lyric Art.

    Chorizo’s post and the fact that Tableau Software included Word Clouds in version 8 gave me the idea for today’s article: I completed the lyrics in my Excel workbook, added some additional information on the albums and created an interactive infographic on Bruce Springsteen’s Discography (studio albums only) in Tableau 8.

    (more…)

  • Build Network Graphs in Tableau

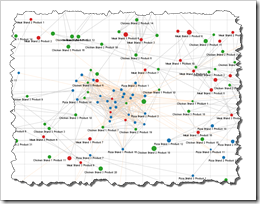
    Visualize Relationships, Connections and Associations in Networks with Tableau Software

    Network Graph TableauClearly and Simply proudly presents a new guest article: Michael Martin of Business Information Arts, Tableau Partner, Tableau Certified Consultant and leader of the Toronto Tableau User Group shows us how to visualize Network Graphs using Tableau Software. Enjoy.

    Network Graphs can help us see and measure relationships and connections between people, places, and things over time. This can be expressed as identifying, measuring and understanding process flows, the mix of products in shopping carts, social network and email traffic, affinities and interests people share (or don’t share), and the “hierarchies of influence” in business and / or social systems by identifying who or what triggers events, and the impacts they have on others.

    Today’s post describes how you can build Network Graphs using Tableau Software versions 6 or 7, including a detailed how-to tutorial and some information on the background of Network Theory.

    (more…)

  • Create Excel Choropleth Maps from Shape Files

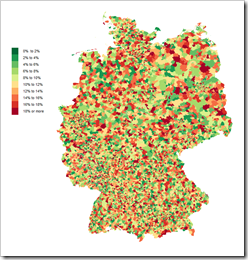
    How to transform Shape Files into Microsoft Excel Choropleth Maps – including 2 Maps of Germany by Zip Codes

    Germany by Zip CodesOn several occasions I thought (and stated) that I already published everything I have to say about Choropleth Maps with Excel.

    Having said that, it seems as if “the ghosts I called I can’t get rid of now”. Recently someone asked me if I could provide an Excel Choropleth Map of Germany by zip codes. Careless and stupid boy I am, I answered “sure this is no problem”. What a misjudgment.

    If you followed my previous Excel Choropleth Map articles, you know that it takes either an Enhanced Metafile of the map you can ungroup in Excel to get the shapes or at least an SVG file to transform it to an EMF file using e.g. Inkscape

    And here is the roadblock I encountered: I simply couldn’t find a map of Germany by zip codes in one of the required formats. All I could find were ESRI shape files. After hours of searching for EMF and SVG files, I gave up, simply reversed my thinking and looked for a tool to convert shape files into SVG. 5 minutes later I had the solution.

    Today’s post describes how to use Indiemapper, a free online tool, to transform shape files into SVG which can then be used for Microsoft Excel Choropleth Maps in the well-known way.

    (more…)