• Writing and Reading Tableau Views to and from Databases and Text Files – Part 1

    How to use R, a Tableau connection to R and Calculated Fields to store and load the underlying data of a defined Tableau View in a Database or Text File (part 1 of 2)

    R - Photographer: Karyn Christner (flickr.com)My good friend Michael Martin is kind enough to contribute another guest post to Clearly and Simply.

    Michael is the Managing Partner at Business Information Arts, Inc, Tableau Partner, Tableau Certified Consultant, Tableau Instructor, leader of the Toronto Tableau User Group and – as Interworks calls him for very good reason – a Tableau Maestro.

    In his article, Michael will show us how to store the underlying data of Tableau Views in a database or a text file using R and Tableau Calculated Fields. Michael's post will come in 2 installments.

    NOTE: It may be necessary to zoom in on some of the graphics within the body of the text below for better legibility.  If you are running 32 bit Microsoft Access under 64 bit Windows, and wish to output the data in a Tableau view to 32 bit Microsoft Access, please read the Appendix to this post before proceeding. Supporting files and a README file are available for download at the end of the second part of the post. Please look at the README file first.

    The author would like to thank Leonid Koyfman for his suggestions.

    Here is part one:

    In the Bar Graph View below (based on the Superstore dataset that comes with Tableau), yearly sales are summed and colored by profit and sized by discount:
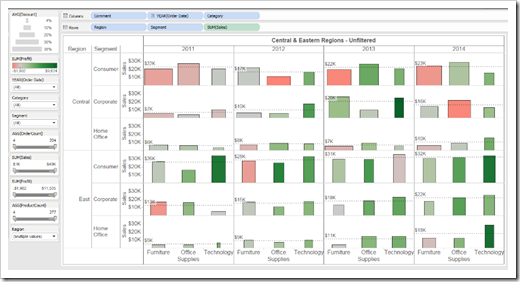
    Superstore View

    Reference lines show average sales within each region and customer segment by year for all categories.

    How can we “capture” the data in this view and save it in a database for further analysis and re-use?

    Tableau does let you view underlying data and copy it to the clipboard, export it to a text file, or even a Microsoft Access database, but these are manual operations. What if you could write a Tableau Calculated Field to export the underlying data in a Tableau View to any Database Server that supports the ODBC protocol?

    You can, using R, and an R language library called RODBC.

    Tableau opened the door to using R language libraries within Calculated Fields in version 8.1. This article walks you through downloading and installing R on a desktop computer, configuring Tableau to use your R installation, and writing the Calculated Fields required to export data from a Tableau view to a database such as SQL Server or Microsoft Access.
    (more…)

  • Zooming in and out of Excel Charts

    Interactive zooming in and out on Charts in Microsoft Excel

    Zoom in and out on Excel ChartsIf you have an XY scatter chart with a lot of data points in Microsoft Excel or even using an XY scatter chart mimicking a map in Excel, an interactive zooming function (allowing to magnify user-defined parts of the chart) can be very helpful.
    Microsoft Excel does not provide such a feature natively. There have been a few workarounds published. Most of them use interactive controls like spinners or sliders to change the axes scales with OFFSET formulas and dynamic cell ranges or by VBA.

    A more intuitive way of zooming into a chart would be to select an area on the chart with the mouse and zoom exactly into this user-defined part of the chart (or map).

    We recently had a couple of posts taking advantage of Andy Pope’s stellar idea to use a label control on top of a chart for interactive chart features:

    Another Technique for Interactive Excel Charts

    Selecting and Highlighting Areas on Excel Charts

    Select Areas on a USA Map in Microsoft Excel

    Andy’s technique is very versatile and can be a viable solution for many different use cases, including the requirement of an interactive zooming feature.

    Today’s post describes an implementation of an interactive zooming feature for a map (XY scatter chart) in Microsoft Excel. As always, the workbook is provided for free download.

    (more…)

  • Select Areas on a USA Map in Microsoft Excel

    Interactive radial or rectangular area selection on a map of the United States in Microsoft Excel

    One of the recent posts demonstrated how to mimic Tableau’s rectangular and radial map selection features in Microsoft Excel:

    Selecting and Highlighting Areas on Excel Charts

    The example workbook used a map of Europe. Since more than 40% of my readership is located in the United States, I thought it might be a good idea to also share a template with a map of the USA. Here it is for free download:

    Download Select and Highlight Areas on a US Map (zipped Microsoft Excel 2010 – 2013 workbook, 1.3MB)

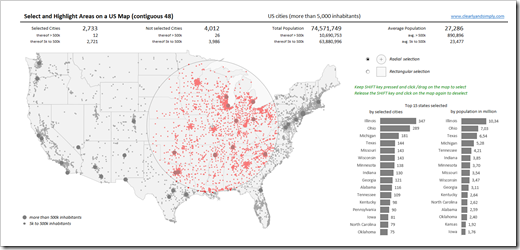
    This is an example screenshot of the dashboard:

    Interactive Selection on a USA Map in Excel - click to enlargeThe map (the contiguous 48 states, i.e. excluding Alaska and Hawaii) includes all cities in the United States with more than 5,000 inhabitants, divided into 2 categories (greater than or less than 500k inhabitants), visualized with different sizes of the dots.

    To define a radial or rectangular selection (choose with the radio buttons), keep the SHIFT key pressed, click somewhere on the map with the mouse key pressed, move the mouse to span the selection area and – as soon as you are done with your selection – release the mouse key. The metrics above the map and the bar charts (selection statistics by states) right to the map are updated on the fly.

    For more details on how to use the template and how this was implemented in Excel, please have a look at the original post.

    I hope this will be helpful, especially for my friends and readers in the United States.

    Stay tuned.

  • Export Excel Dashboards (Improved Version)

    An improved version of the example workbook exporting Excel Dashboards to other applications

    Improvement - Photographer: Celestine Chua (flickr.com)The previous post provided an example Excel model with the option to export dashboards to other applications and file formats.

    The workbook came with one serious limitation: the PDF and XPS export routine created a separate file for each dashboard, instead of one file with all dashboards.

    In the article I stated, I wouldn’t see how to get around this without using an external PDF creator. It turns out that I simply couldn’t see the wood for the trees.

    It was (again!) Leonid Koyfman, long-time reader and contributor, who pointed me into the right direction. The idea is as simple as it is efficient: create a temporary Excel workbook, copy all dashboards to it (each dashboard on a separate sheet), use the ExportAsFixedFormat method of the workbook object to export the entire workbook (i.e. all dashboards) to one PDF or XPS file and finally close the temporary workbook without saving changes. So simple, so obvious. I should have figured that out on my own. But I didn’t. Many thanks to Leonid for the idea.

    Here is the improved version for free download:

    Download Export Excel Dashboard to other Applications – Improved Version (zipped Microsoft Excel 2010 – 2013 workbook, 210K)

    Stay tuned.

  • Export Excel Dashboards to other Applications

    How to export Microsoft Excel Dashboards to PowerPoint, Word, PDF, XPS or Pictures

    Export Excel to other ApplicationsEarlier this week I received an email from Andrea, one of my few, but faithful readers. Andrea stumbled across a post from 2010 describing how to export Excel dashboards to PowerPoint and asked if I was planning a follow-up post about exporting from Excel to Microsoft Word.

    Truth be told, not up to that point. I personally barely export from Excel at all, but if I do, I usually export to PowerPoint.

    However, I found Andrea’s idea interesting for several reasons: exporting Excel dashboards to other applications and file formats may indeed be helpful, e.g. for creating reports or papers in Microsoft Word. Furthermore the original implementation exported three different dashboards, but the best use case for a bulk export to another application is an Excel dashboard displaying one selected period out of many or a dashboard with various filter options. In this case it can be a real time-saver if you have the option to export e.g. all weekly reports of a quarter or a defined set of filter combinations in one go. Last, but not least, it is actually no big deal to adjust the original code for other applications and file formats.

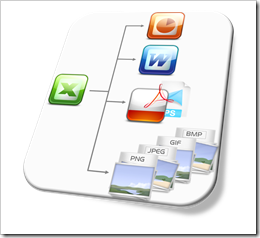
    Today’s article provides an example workbook which allows to export the dashboards to PowerPoint, Word, PDF, XPS and some picture file formats (PNG, JPEG, GIF, BMP). As always, the post includes a link to the Excel workbook for free download.

    (more…)