How to create customizable, meaningful tooltips on XY Scatter Charts in Microsoft Excel
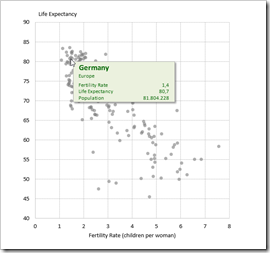 Back in December 2010, I published an article about Better Chart Tooltips with Microsoft Excel. The post described the weaknesses of Microsoft Excel’s standard chart tooltips and provided a VBA-based technique how to get to customizable, meaningful and more useful tooltips in Excel.
Today, I would like to revisit this topic for several reasons:
Firstly, Microsoft hasn’t done anything about this shortcoming in the versions 2013 and 2016. The problem of insufficient chart tooltips in Excel remains.
Secondly, the workbook provided in 2010 implemented the better chart tooltips on another dashboard with additional features, which was published here: Bluffing Tableau Actions with Microsoft Excel. Many people have asked for a simplified, generic template only providing the tooltips on a standard XY Scatter chart.
Next, reader Will Clark came up with the great idea of using a camera object instead of a simple textbox, in order to have more formatting options.
Last, but not least, I discovered another approach for creating interactive charts in Excel. I already used and published this in several posts (Another Technique for Interactive Excel Charts, Selecting and Highlighting Areas on Excel Charts, Select Areas on a USA Map in Microsoft Excel and Zooming in and out of Excel Charts), but this technique is also viable for implementing chart tooltips.
Today’s post will discuss again Excel’s shortcomings in terms of chart tooltips, briefly describe 4 different techniques how to overcome this issue and – as always – provide the Microsoft Excel workbooks for free download.
The Requirement and Excel’s Shortcoming
Tooltips are a very helpful feature for exploring and analyzing data. This is especially the case on XY Scatter or Bubble charts with a lot of data points.
An XY Scatter Chart is the perfect choice to display the relationship between two variables X and Y and the distribution of the data regarding these two measures. However, without further chart elements (like data labels) or interactive features (like tooltips), there is no way to easily explore and analyze the data in detail, e.g. examine the maximums and minimums or the outliers.
Let’s have a look at an example. Here is an XY Scatter chart comparing fertility rate (children per woman) and life expectancy in years of more than 200 countries in the year 2013 (data source: Gapminder):
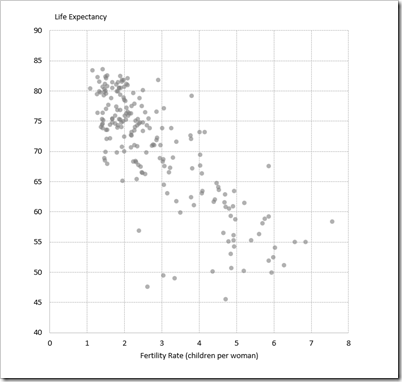
You now easily see the distribution of the data and the relationship between the two variables. But what if you want to analyze the data in more detail and get some information about e.g. the country at bottom left with a relatively low fertility rate of ~2.5 and a life expectancy of only ~47 years?
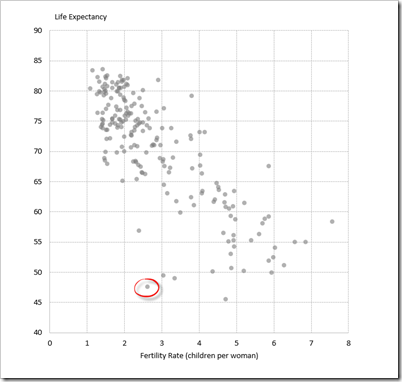
Knowing the exact values of the two measures is certainly one thing you are interested in. More important, however, is the very simple question: which country is this?
Adding data labels is usually not an option, because with this amount of data points, labels will clutter the entire chart and make the view useless. Thus, tooltips are the best way to display additional information on user request, i.e. when hovering the mouse over a data point.
Shouldn’t be a problem, right? Excel does provide tooltips on charts, doesn’t it?
Yes, it does and here is how this looks like in our example:
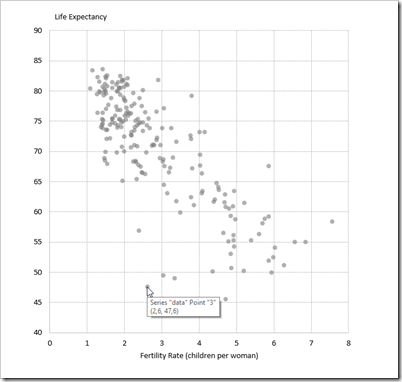
Excel’s tooltip gives us the name of the data series (which can be helpful, if you have more than one), information about the point (Point “3”) and the exact values of the measures (2.6, 47.6).
You may assume, Point “3” means that this country is the third row in the data source, but it isn’t. Point “3” means that this point belongs to the third category of the X-axis. All data points with an X-value between 2.6 and 3.5. belong to category 3, all points with an X-value between 3.6 and 4.5 belong to category 4, and so forth.
So, you can’t even use the point-information to look up the country in the data table.
The only way to get to the name of the country is to
- remember the values of the measures
- switch to the data table
- sort the data table by fertility rate and life expectancy (this is optional, but definitely helpful for the next step)
- and finally scroll through the data table to find the row with the values of fertility rate and life expectancy and get the name of the country
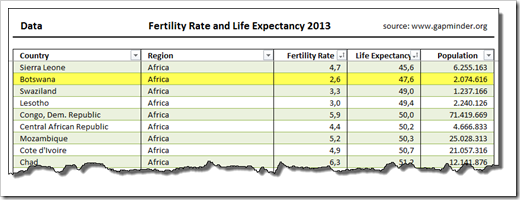
Now we see it. It’s Botswana. It works, but I am sure you will agree that this procedure is everything else than convenient, effective and user-friendly.
Let’s have a look at other data analysis and data visualization applications. Based on the same data, it took me less than 3 (!) minutes to create the following view with Tableau Software (including the formatting of the tooltip):
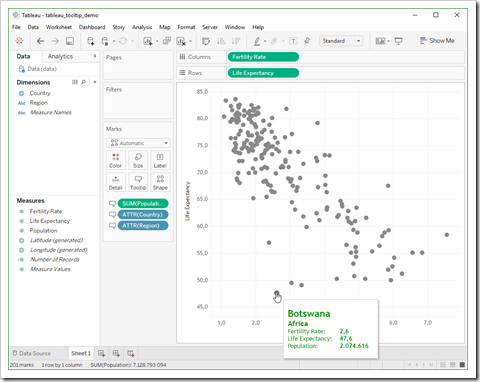
Hovering over any given data point, the tooltip displays the values of a selection or (like in this example) even all dimensions and measures in the data.
Although it definitely should, Microsoft Excel does not provide a standard option to customize the chart tooltips. All you can do is turning them on or off in the advanced Excel options.
As always, VBA can help to overcome this shortcoming: a few extra formulas in a formatted cell range, a camera object and a few lines of VBA code and you can provide your user with a tooltip functionality comparable to Tableau:
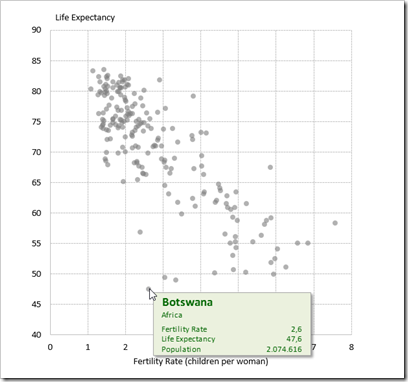
The following sections will describe four techniques of how to create meaningful and easy-to-use tooltips on an XY Scatter chart.
Technique 1 – Chart Mouse Move Event and a Textbox
This is exactly the technique used in the article Better Chart Tooltips with Microsoft Excel. For a more detailed description of the steps, please refer to that post.
Here is just an overview of the required elements and code:
- An additional column in the data table with the tooltip texts (created by a string concatenation formula)
- A formatted and named freeform textbox (“myshpTooltip”) on the worksheet with the embedded chart
- Jon Peltier’s chart event code provided here: Get XY on any Chart
- The points per pixel function from the great book “Professional Excel Development” by Stephen Bullen, Rob Bovey and John Green
- Adjustments of the sub myEmbeddedChart_MouseMove to detect the position of the mouse and – if the mouse hovers over a data point on the chart – assign the defined tooltip text to the textbox and make the tooltip visible. Otherwise the textbox is set back to invisible. If you are interested in the details, have a look at the VBA code of the template (download link see below)
That’s it. A text formula, a textbox and 117 lines of VBA code.
The disadvantage: the tooltips are only visible if the chart is selected, i.e. the user has to click on the chart first before the tooltips appear.
Technique 2 – Chart Mouse Move Event and a Camera Object
The second technique is a slight variation of the first one: instead of using a simple textbox and changing the text via VBA, a camera object is used as the tooltip:
- The additional column in the data table is not needed, because the code does not assign a text to the shape anymore.
- Instead, it writes the index of the current data point (i.e. the one the mouse hovers over) to a cell called [myPointIndex]
- Based on the value of [myPointIndex], the relevant information is fetched from the data table by simple INDEX formulas in a cell range called [myTooltip]
- The cell range [myTooltip] can now be formatted as desired (font type, sizes and color, number formats, alignment, etc.)
- Finally a camera object is inserted on the worksheet with the embedded chart, named “myshpTooltip” and linked to the cell range [myTooltip]
The major advantage of technique 2 is the option to format the text of the tooltip as you like.
Technique 3 – Label Mouse Move Event and a Textbox
Last year, I discovered another technique to implement interactivity on Excel charts. Excel MVP Andy Pope uses an ActiveX label control on top of a chart to track and manage mouse positions. The main advantage compared to techniques 1 and 2: Andy’s approach doesn’t require to activate the chart first.
- Like in technique 1, we need an additional column in the data table with the tooltip texts
- The heart of the solution is an ActiveX label control (insert one via the DEVELOPER tab and Insert):
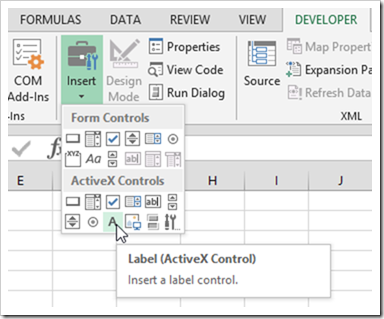
- Position and resize the label control to sit exactly on top of the plot area of the chart
- Format the label control to be invisible (white back color and transparent back style)
- On the additional worksheet Control, define three named ranges ([myCurrentX], [myCurrentY] and [myDisplayTooltip]) and a data entry cell to let the user define a tolerance deviation
- Add the MouseMove event sub of the label control on the worksheet object of the sheet with the XY scatter chart
- The code inside this sub calculates the values (not the coordinates) of the current mouse position and writes them to the cell ranges [myCurrentX] and [myCurrentY]
- On the worksheet Control, an array formula using MATCH, SQRT and MIN detects the nearest neighbor in the data to the current position (cell C9 on worksheet Control)
- The named cell [myDisplayTooltip] contains a formula checking if the nearest neighbor is within the user-defined tolerance to the current mouse position. If it is, the formula returns TRUE, otherwise FALSE
- The code checks the value of [myDisplayTooltip] and if it is TRUE, the text will be added to the textbox, it will be positioned on the worksheet and made visible. If [myDisplayTooltip] is FALSE, the code hides the tooltip
That’s it. Agreed, compared to technique 1, you need an additional worksheet and more complex formulas. On the other hand, the code is even slimmer (only 52 lines).
Technique 4 – Label Mouse Move Event and a Camera Object
This is a variation of technique 3 and – similar to technique 2 – uses a camera object instead of a textbox.
Not so much to explain here, I guess.
The Disadvantages
All four techniques are workarounds and – like most workarounds – they all have their disadvantages:
- Techniques 1 and 2 are not working seamlessly. You have to activate the chart first (i.e. click on the chart area) to make the tooltips working. This is not intuitive and the user has to know this
- Techniques 3 and 4 are providing a more seamless user experience, but they only work at a zoom level of 100% and if the entire chart is visible in the application window. The code forces the zoom level to 100% and this usually solves the issue, but it is still a drawback
- Techniques 1 and 3 are very limited in terms of formatting options
- Techniques 2 and 4 provide more formatting options, but the camera object is known to be a bit buggy sometimes and may lead to problems under certain circumstances
- All techniques require VBA
- All techniques require a considerable time for setting up the workbook, the chart and the code
Agreed, a lot of disadvantages, but the techniques are working and provide much better chart tooltips than Excel’s standard.
Download Link
Here is a zipped folder containing one template for each of the four techniques described above for free download:
Download tooltips on XY scatter charts (4 zipped Excel 2007-2016 workbooks, 215.9K)
Acknowledgements
Many thanks go again to Microsoft Excel MVP Jon Peltier for providing the chart mouse event code and to Microsoft Excel MVP Andy Pope for sharing the idea of using a label control for chart interactivity (see here: Clocks). Thank you, gentlemen.
More new posts to come soon.
Stay tuned.
Leave a Reply