How to transform Shape Files into Microsoft Excel Choropleth Maps – including 2 Maps of Germany by Zip Codes
 On several occasions I thought (and stated) that I already published everything I have to say about Choropleth Maps with Excel.
Having said that, it seems as if “the ghosts I called I can’t get rid of now”. Recently someone asked me if I could provide an Excel Choropleth Map of Germany by zip codes. Careless and stupid boy I am, I answered “sure this is no problem”. What a misjudgment.
If you followed my previous Excel Choropleth Map articles, you know that it takes either an Enhanced Metafile of the map you can ungroup in Excel to get the shapes or at least an SVG file to transform it to an EMF file using e.g. Inkscape.
And here is the roadblock I encountered: I simply couldn’t find a map of Germany by zip codes in one of the required formats. All I could find were ESRI shape files. After hours of searching for EMF and SVG files, I gave up, simply reversed my thinking and looked for a tool to convert shape files into SVG. 5 minutes later I had the solution.
Today’s post describes how to use Indiemapper, a free online tool, to transform shape files into SVG which can then be used for Microsoft Excel Choropleth Maps in the well-known way.
The Challenge
The Choropleth Map approach I used in all articles here requires ungrouped shapes in Excel. The easiest way of getting there is an EMF file you simply import into Excel and ungroup it until you have one shape for each region you want to visualize. If you don’t have an EMF file, this article shows you how to transform an SVG file into EMF format.
But what if you can find the map you need neither in EMF nor in SVG format. Global Administrative Areas, for one, provides the administrative regions of all countries of the world. The problem: they are ESRI shapes files, not EMF or SVG.
Today’s challenge is to find an easy way of transforming ESRI shape files into EMF which can be directly used in Excel for creating Choropleth Maps.
The Solution – Indiemapper
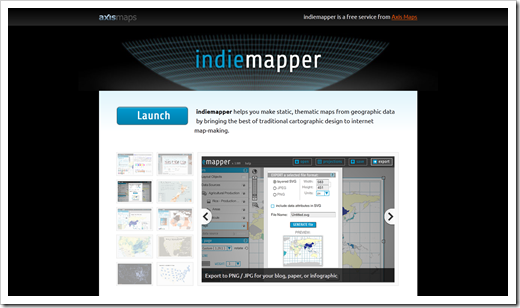
Indiemapper is a free service provided by Axis Maps making static, thematic maps from geographic data. It also as an export feature to transfer shape files into SVG, JPG and PNG.
After launching Indiemapper, click on Shapefile and browse for the file on your computer.
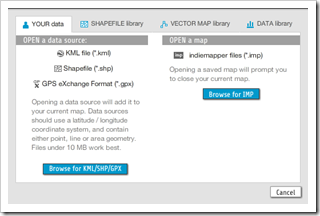 If available, also upload the .dbf file in the following dialogue.
Step 2: Skip New Layer Option
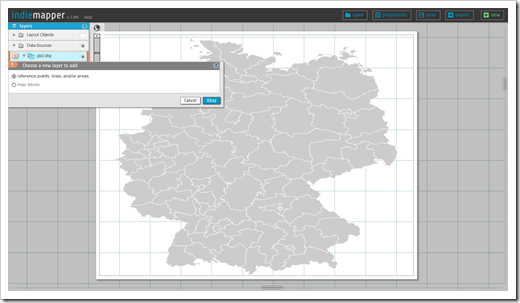
Skip the next dialogue window to add a new layer by clicking on Cancel:
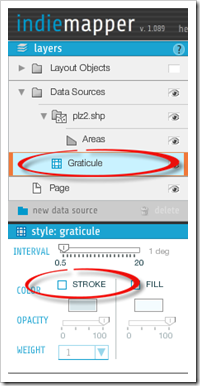
 Step 3: Turn off the Graticule
If necessary (like it was in my case), uncheck the strokes checkbox in the Graticule window.
Step 4: Export
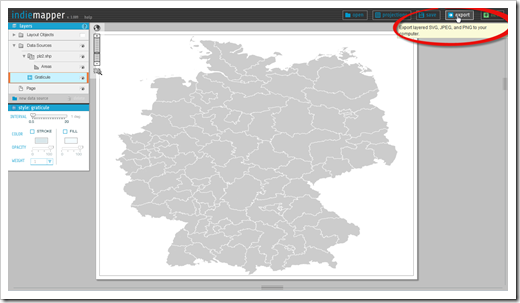
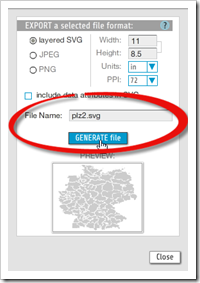
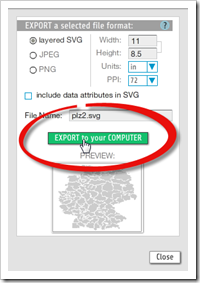
Click on export at the top right of the website, choose “layered SVG”, select a filename and click on Generate File:
Finally export the generated SVG file to your computer:
That’s it. In 4 simple steps we transformed an ESRI Shape File into SVG, i.e. the file format we can now transform into an EMF file and prepare it for being used as a Choropleth Map in Excel, exactly the way I already described it here: Build your own Choropleth Maps with Excel.
The Show Case – Germany by Zip Codes
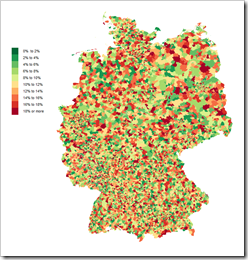
With the few steps described above combined with the technique to transform SVG files into Excel Choropleth Maps (here), I was able to produce the following 2 maps of Germany by zip codes in almost no time.
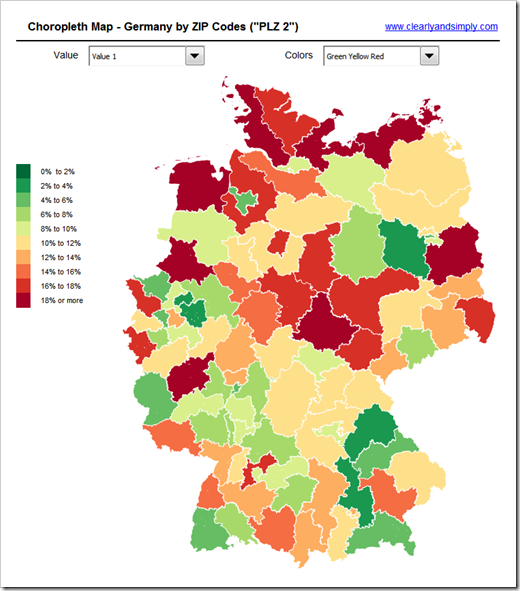
For your understanding: German zip codes have 5 digits and there are more than 8,200 of them (only the ones which represent a geographical region). Very often, geographical visualizations use only the first 2 digits of the zip code, dividing Germany into 95 regions. 95? Shouldn’t that be 99? No. the remaining 4 are unused or do not represent a geographical area.
So, here is a map of Germany by zip code 2 (what we call PLZ 2):
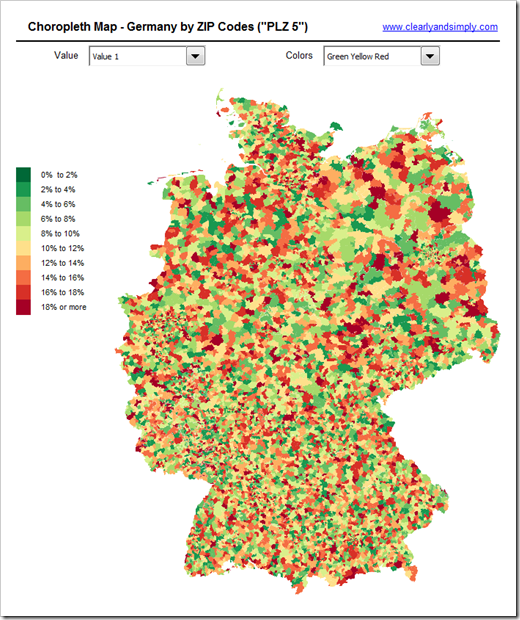
 And here is the comprehensive one: Germany by zip code 5 (PLZ 5) with more than 8,200 shapes:
The Disadvantages
Let’s call a spade a spade: using Choropleth Maps in Microsoft Excel is nothing else than the poor man’s geographical visualization tool. It takes some time and know-how to set them up and they come with a couple of disadvantages.
The zip code 2 map with 95 shapes works pretty well. With the zip code 5 map, however, the technique is definitely reaching its limits:
- More than 8,200 shapes bloat the file size to almost 9 MB
- Although I used the optimized VBA code provided here, the map takes around 10 seconds to update on my machine. Everything else than a good performance and user experience
Still, if you do not have a professional geographical visualization tool available, Microsoft Excel can be a reasonable workaround, even for a very detailed map like Germany by zip codes.
The Download Links
Germany by zip code 2 (PLZ 2):
Download Choropleth Map Germany by Zip Code 2 (Microsoft Excel 2007/2010, 965.7K)
Germany by zip code 5 (PLZ 5):
Download Choropleth Map Germany by Zip Code 5 (Microsoft Excel 2007/2010, 8910.4K)
The data used in these example workbooks is made up.
Acknowledgements
Many thanks go to the developers of Indiemapper, Zachary Johnson, Andy Woodruff, Dave Heyman, Ben Sheesley and Mark Harrower for creating this great online tool and to Axis Maps for providing it for free. Thank you!
Stay tuned.
Leave a Reply