Create Excel Choropleth Maps from Shape Files

How to transform Shape Files into Microsoft Excel Choropleth Maps – including 2 Maps of Germany by Zip Codes
Germany by Zip CodesOn several occasions I thought (and stated) that I already published everything I have to say about Choropleth Maps with Excel.

Having said that, it seems as if “the ghosts I called I can’t get rid of now”. Recently someone asked me if I could provide an Excel Choropleth Map of Germany by zip codes. Careless and stupid boy I am, I answered “sure this is no problem”. What a misjudgment.

If you followed my previous Excel Choropleth Map articles, you know that it takes either an Enhanced Metafile of the map you can ungroup in Excel to get the shapes or at least an SVG file to transform it to an EMF file using e.g. Inkscape

And here is the roadblock I encountered: I simply couldn’t find a map of Germany by zip codes in one of the required formats. All I could find were ESRI shape files. After hours of searching for EMF and SVG files, I gave up, simply reversed my thinking and looked for a tool to convert shape files into SVG. 5 minutes later I had the solution.

Today’s post describes how to use Indiemapper, a free online tool, to transform shape files into SVG which can then be used for Microsoft Excel Choropleth Maps in the well-known way.

The Challenge

The Choropleth Map approach I used in all articles here requires ungrouped shapes in Excel. The easiest way of getting there is an EMF file you simply import into Excel and ungroup it until you have one shape for each region you want to visualize. If you don’t have an EMF file, this article shows you how to transform an SVG file into EMF format.

But what if you can find the map you need neither in EMF nor in SVG format. Global Administrative Areas, for one, provides the administrative regions of all countries of the world. The problem: they are ESRI shapes files, not EMF or SVG.

Today’s challenge is to find an easy way of transforming ESRI shape files into EMF which can be directly used in Excel for creating Choropleth Maps.

The Solution – Indiemapper

Indiemapper is a free service provided by Axis Maps making static, thematic maps from geographic data. It also as an export feature to transfer shape files into SVG, JPG and PNG.

IndiemapperStep 1: Load your Shape Files

After launching Indiemapper, click on Shapefile and browse for the file on your computer.
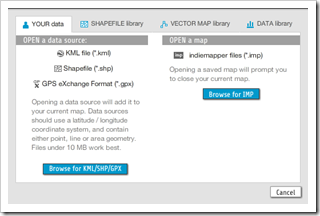
Browse for Shape File - click to enlargeIf available, also upload the .dbf file in the following dialogue.

Step 2: Skip New Layer Option

Skip the next dialogue window to add a new layer by clicking on Cancel:
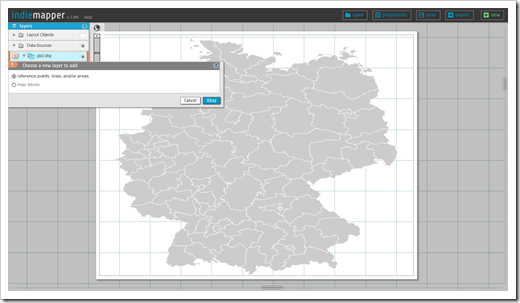
Skip New Layer Option - click to enlargeStep 3: Turn off the Graticule

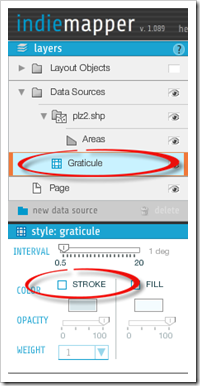
Graticule - click to enlarge

If necessary (like it was in my case), uncheck the strokes checkbox in the Graticule window.

Step 4: Export 

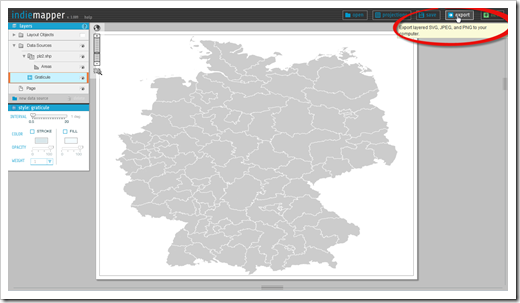
Export - click to enlarge

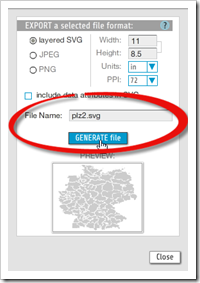
Click on export at the top right of the website, choose “layered SVG”, select a filename and click on Generate File:

Generate File - click to enlarge

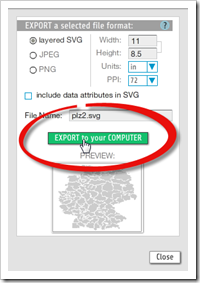
Finally export the generated SVG file to your computer:

Export File - click to enlarge

That’s it. In 4 simple steps we transformed an ESRI Shape File into SVG, i.e. the file format we can now transform into an EMF file and prepare it for being used as a Choropleth Map in Excel, exactly the way I already described it here: Build your own Choropleth Maps with Excel.

The Show Case – Germany by Zip Codes

With the few steps described above combined with the technique to transform SVG files into Excel Choropleth Maps (here), I was able to produce the following 2 maps of Germany by zip codes in almost no time.

For your understanding: German zip codes have 5 digits and there are more than 8,200 of them (only the ones which represent a geographical region). Very often, geographical visualizations use only the first 2 digits of the zip code, dividing Germany into 95 regions. 95? Shouldn’t that be 99? No. the remaining 4 are unused or do not represent a geographical area.

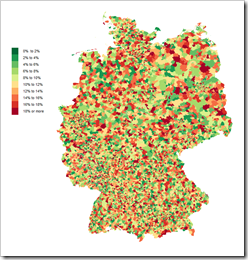
So, here is a map of Germany by zip code 2 (what we call PLZ 2):
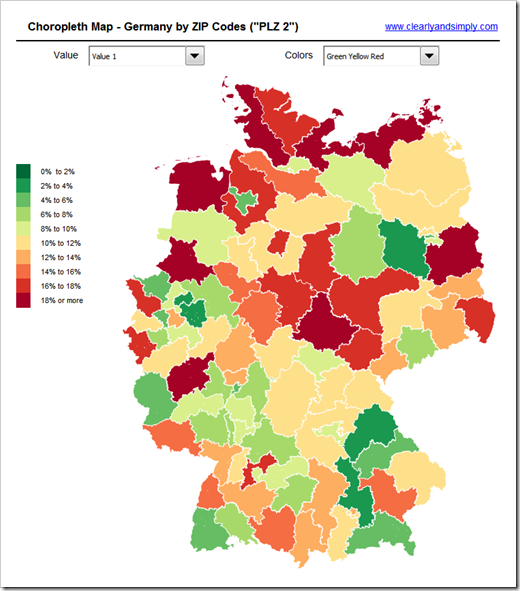
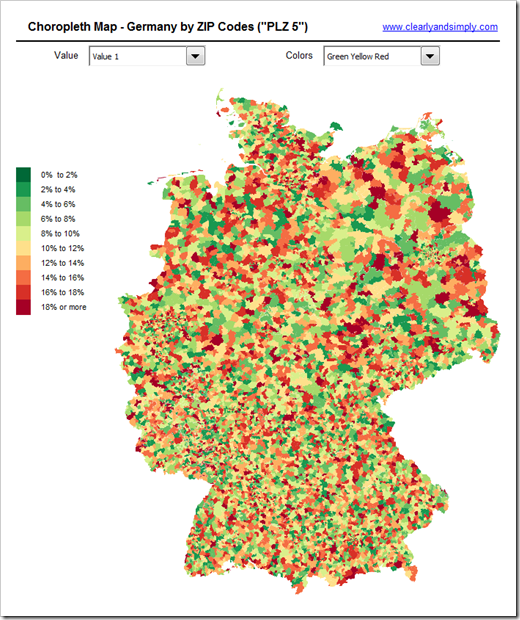
Germany by Zip Code 2 - click to enlargeAnd here is the comprehensive one: Germany by zip code 5 (PLZ 5) with more than 8,200 shapes:

Germany by Zip Code 5 - click to enlarge

The Disadvantages

Let’s call a spade a spade: using Choropleth Maps in Microsoft Excel is nothing else than the poor man’s geographical visualization tool. It takes some time and know-how to set them up and they come with a couple of disadvantages.

The zip code 2 map with 95 shapes works pretty well. With the zip code 5 map, however, the technique is definitely reaching its limits:

  • More than 8,200 shapes bloat the file size to almost 9 MB
  • Although I used the optimized VBA code provided here, the map takes around 10 seconds to update on my machine. Everything else than a good performance and user experience

Still, if you do not have a professional geographical visualization tool available, Microsoft Excel can be a reasonable workaround, even for a very detailed map like Germany by zip codes.

The Download Links

Germany by zip code 2 (PLZ 2):

Download Choropleth Map Germany by Zip Code 2 (Microsoft Excel 2007/2010, 965.7K)

Germany by zip code 5 (PLZ 5):

Download Choropleth Map Germany by Zip Code 5 (Microsoft Excel 2007/2010, 8910.4K)

The data used in these example workbooks is made up.

Acknowledgements

Many thanks go to the developers of Indiemapper, Zachary Johnson, Andy Woodruff, Dave Heyman, Ben Sheesley and Mark Harrower for creating this great online tool and to Axis Maps for providing it for free. Thank you!

Stay tuned.
Comments

27 responses to “Create Excel Choropleth Maps from Shape Files”

  1. Marcus Avatar
    Marcus

    I ended up using Indiemapper to create my maps.
    Thank you for a new choropleth map post and your advice.

  2. Robert Avatar

    Marcus,
    did you receive one of my emails I sent earlier as a reply to your email? I tried from different email accounts, but your email provider seems to block all of my messages.

  3. Marcus Avatar
    Marcus

    I did. The third one got through.
    I was waiting to respond as I’ve moved to Excel 2010 and wanted to get the map with the bar chart working before I followed up.
    Indiemapper is a terrific resource and what I like about it is that if you zoom in you can select just the shapes you want in a particular region. As an added bonus, any partial shapes on the edge of your zoomed in region are still captured whole so nothing is cut off.
    You may still have to selectively delete shapes to get the region you want exactly.
    Thanks again, Robert.

  4. Stefan Avatar
    Stefan

    Hi Robert,
    i tried to open the files, but, i couldn´t, due to the format.
    Your nice divided (in two maps) work could be done in one map, if You use a shape modyfying UDF, where You chose, which shape to show. But on the other hand, i tried to do Your work for Austria and it was very hard to get it in one map (which isn´t too big). – even to get all the maps for the zip codes, was not very handy.
    best regards,
    Stefan

  5. Robert Avatar

    Stefan,
    thanks for your comment.
    Re: issues when opening the files.
    I suspect you tried to open the files by directly clicking on the link and Windows opened them using the Windows Explorer (zipped folder) instead of Excel? Excel 2007/2010 files are in fact zipped folders containing several XLM and other files. Simply right click on the download link, save the file to your hard drive and open it by double clicking from your hard drive. This way Windows will recognize the file as XLSM and open it in Microsoft Excel.
    Re: Merging the 2 maps into one workbook
    Interesting. Believe it or not, Leonid had a very similar idea and we will publish a follow up article demonstrating this very soon.

  6. Denis Avatar

    You can find many maps already prepared for for Excel at http://www.deixsys.com

  7. Robert Avatar

    Denis,
    many thanks for this link. A very nice collection of ready to use Excel maps. Still, if you need something else (like Germany by ZIP codes in my case), the technique described above is a fast and efficient way of creating the map you need.

  8. Rob Avatar
    Rob

    This is a very helpful technique. However, I was wondering if it was possible from a KML format to import this directly into excel and have it create shapes based on the co-ordinates given? I’ve tried importing it as a standard XML but this tends not to work because of the way KML stores the coordinates pairs.
    Rob

  9. Robert Avatar

    Rob,
    thanks for your comment. I am sorry but I have no clue if it is possible to import KML files directly into Excel. If you find a way, please let us know.
    Having said that, I never tried, but Indiemapper also offers the option to import KML files, so I think it would be well worth a try.

  10. Robert Avatar
    Robert

    Hi,
    Really really interesting one!
    I’ve been working on these several days, but I’m unable to make it work correctly. I don’t know why, using “Choropleth Map Germany by Zip Code 2 (Microsoft Excel 2007/2010)” as a template, I can’t make work all of my 10 Shapes! And I don’t why, because I have renamed them from S_01 to S_10, but the last down don’t catch the data values, and don’t show color. Do you know what would be the issue?
    Thanks for all!

  11. Robert Avatar

    Robert,
    thanks for your comment and sorry for the late reply. If it is working for all shapes except for the last one, I suspect you have another object on your dashboard (e.g. a combo box) and this additional object is not the last object on the sheet. Go to the Selection Pane and bring this object to the top of the list shown there.
    If this doesn’t solve the issue, you can send me your workbook by email and I will have a look (email-link at the top of the blog).

  12. Lilian Cipciriuc Avatar

    Hello ppl. Somehow i’ve got to visit this page in the weekend and was trying to play with map of my country Moldova and couldn’t find something better. So, finally i’ve got to find this site which contains a lot of maps and file formats – gif, pdf, cdr, ai, wmf, look here http://d-maps.com/ although i couldn’t figure out, yet, how to rename or link the shapes in excel. if anyone can share some knowledge would be thankful, or at least some links

  13. Robert Avatar

    Lilian,
    thanks for your comment. Here is a step by step how to insert your own map:
    1. Download a WMF or EMF map from e.g. d-maps
    2. Open Excel and insert the picture (Insert|Pictures)
    3. Select the inserted picture and ungroup it (Format|Group|Ungroup or right click Group|Ungroup). You will see a warning message (“This is an imported image, not a group…”). Confirm by clicking on Yes.
    4. Repeat the ungrouping until the ungroup command is not available anymore.
    5. Delete all shapes you do not need, like the border and background of the image, the legend, etc. The Moldova map from d-maps has two shapes for each district / region (the outline and the fill). In this case, delete e.g. all the shapes with the district fill colors until you have a map in Excel with exactly one shape for each district.
    6. Finally, you have to assign the names to all districts. Select a shape and give it a name either in the name box (right above cell A1) or in the Selection Pane (Find&Select|Selection Pane). Repeat this step for all districts.

  14. Divy Avatar
    Divy

    .Hi Robert! Excellent Coverage. One questions, how do I get the Asia Pacific Customized Map? Please Help!

  15. Robert Avatar

    Divy,
    I do not know of a site providing the Shape Files with the Asia Pacific region, but you could download a shape file map of the world (e.g. http://www.diva-gis.org/Data) and delete everything outside the Asia Pacific region.
    You could also download a WMF map from http://www.d-maps.com or Wikimedia Commons and create the Choropleth Map by following the instructions described in this article:

    Build your own Choropleth Maps with Excel

  16. Ola.S Avatar
    Ola.S

    Thanks for great posts.
    I just wanted to contribute with a simple tip.
    Consider saving Excel files as .xlsb
    I just downloaded one of your 1Mb .xls files and saved it as .xlsb using only 270kb.
    //Ola

  17. Robert Avatar

    Ola,
    thanks for your comment and tip. I agree, .xlsb files are smaller than .xlsx or .xlsm files. Workbooks containing many freeform shapes however cannot be considerably reduced in size by using the binary file format.
    Saving the two workbooks posted for download in the article above (2007-2013 workbooks, i.e. .xlsm) as .xlsb reduces the file sizes only marginally from 965 KB to 952 KB and from 8,911 KB to 8,590 KB.
    The effect of cutting a 1 MB workbook down to 270 KB you are describing isn’t coming from the binary file format. It is rather due to the fact that by saving it as .xlsb, you are upgrading from file format Excel 2003 to file format Excel 2007 – 2013.
    For instance: the Choropleth Map of the World provided in the very first article in 2009 (posted in Excel 2003 format .xls) has the following file sizes in different formats:
    2003 (.xls): 1,077 KB
    2007 – 2013 (.xlsm): 255 KB
    2007 – 2013 binary (.xlsb): 242 KB
    In a nutshell: you are correct, all workbooks posted in Excel 2003 format can be considerably reduced in file size. However, not so much by using the binary file format, but rather by upgrading them to 2007 / 2013.

  18. Stefan Avatar
    Stefan

    hi Robert, i solved the problem, opening the files in Firefox and Chrome. It was an instant IE-problem.

  19. Xavier Avatar
    Xavier

    But where can ye get a dataset by Zip Code, it is quite hard to find!???

  20. Robert Avatar

    Xavier,
    you are right, shapefiles for ZIP-codes are harder to find than administrative areas. Some sites are selling ZIP-code shapefiles, but I do not know of a site where you could download ZIP-code maps for free. Wikimedia Commons is usually a good resource, but no guarantee. I am sorry.

  21. Alberto Avatar
    Alberto

    Hi Robert!
    First of all, thanks for this very helpful tutorial.
    I’m trying to build a cloropleth map for italian zip codes.
    i would like to convert a shape file in SVG but it doesn’t work on indiemapper. Apparently it uses a coordinated system not supported.
    The database (.zip format) is available here, http://www.istat.it/it/archivio/104317 “limiti comunali” is the database and i would like to use 2011 version.
    Any recommendation? I will share the file with the community once i’m able to work on it.
    Thank you in advance!

  22. Robert Avatar

    Alberto,
    I downloaded the files and I can reproduce the issue with Indiemapper.
    First of all: I am not familiar at all with Italy’s administrative or zip code regions, but I don’t think the shape file provided in your download link contains the zip codes. It seems to be a map of Italy by counties (commune).
    If you are looking for an Italian map by counties, you can download the shape files from this link:
    http://www.gadm.org/country
    The shape files provided there work well with Indiemapper.

  23. Nanna Avatar
    Nanna

    This wonderful! Not only got I exactly the map I was looking for, by analyzing how the values change, I learned how to create my own maps and color codes which is even better. Thank you so much for all your hard work!!!

  24. tj33 Avatar
    tj33

    Is it possible to use this for an excel workbook with multiple maps on different worksheets? Can this use one central data entry or should each map sheet be set up separately?

  25. Robert Avatar

    tj33,
    as is, the workbook with a Choropleth Map in Excel only works with one map.
    However, it is possible to use the approach to also color several maps on several worksheets in one workbook. You have to adjust and enhance quite a few things in the workbook and in the code, though:
    You need multiple instances for the ranges of values, shape names, shape index, legend and the range mapping values to colors. Furthermore you have to adjust the code and call the UpdateChoroplethMap sub with the according parameter / ranges for each map.
    A little bit of work to do, but not impossible.

  26. Patrik Avatar
    Patrik

    Hi, how can I visualize value of PLZ in 2 digit map? I mean I want to see number 98 in zone 98.

  27. Robert Avatar

    I am sorry, but I am not sure what your issue is. Just paste the data you want to visualize on the data worksheet. If you want to see 98 for PLZ2 98 just insert this number into the according row on the data worksheet and run the macro by e.g. selecting another color scheme.

Leave a Reply to Marcus Cancel reply

Your email address will not be published. Required fields are marked *