Category: Visualization

  • Create Excel Choropleth Maps from Shape Files

    How to transform Shape Files into Microsoft Excel Choropleth Maps – including 2 Maps of Germany by Zip Codes
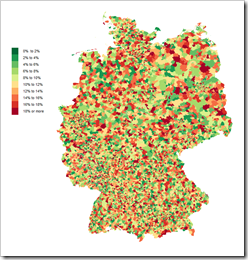
    Germany by Zip CodesOn several occasions I thought (and stated) that I already published everything I have to say about Choropleth Maps with Excel.

    Having said that, it seems as if “the ghosts I called I can’t get rid of now”. Recently someone asked me if I could provide an Excel Choropleth Map of Germany by zip codes. Careless and stupid boy I am, I answered “sure this is no problem”. What a misjudgment.

    If you followed my previous Excel Choropleth Map articles, you know that it takes either an Enhanced Metafile of the map you can ungroup in Excel to get the shapes or at least an SVG file to transform it to an EMF file using e.g. Inkscape

    And here is the roadblock I encountered: I simply couldn’t find a map of Germany by zip codes in one of the required formats. All I could find were ESRI shape files. After hours of searching for EMF and SVG files, I gave up, simply reversed my thinking and looked for a tool to convert shape files into SVG. 5 minutes later I had the solution.

    Today’s post describes how to use Indiemapper, a free online tool, to transform shape files into SVG which can then be used for Microsoft Excel Choropleth Maps in the well-known way.

    (more…)

  • Roll Over Tooltips and Web Actions on a Microsoft Excel Dashboard

    Bluffing the “Beer Prices at Oktoberfest” Tableau Dashboard with Microsoft Excel using Roll Over Tooltips and Web Actions

    Oktoberfest Impressionen - Photographer: sanfamedia (flickr.com)Recently we had an article visualizing the beer prices and beer price development at Oktoberfest with a Tableau dashboard: O'zapft Is!

    Oktoberfest is long over already and there is peace in the valley of Munich again. Having said that, I would like to come back to this visualization once more. We had a couple of posts here on Clearly and Simply showing how to bluff Tableau’s great interactive features with Microsoft Excel:

    Bluffing Tableau Actions with Microsoft Excel

    Bluffing a Visual Cross-tab with Excel

    The Next Level of Interactive Microsoft Excel Dashboards

    Microsoft Excel Site Catchment Analysis

    Drawing on this tradition, today’s article presents an Excel workbook emulating the Tableau Oktoberfest Dashboard. The technique behind this bluff is a very clever approach my blogging colleague Jordan Goldmeier published in several articles over at his Option Explicit VBA Blog.

    Stealing Jordan’s idea, today’s post shows how to recreate the Oktoberfest Beer Price Tableau dashboard with Microsoft Excel, as always including the Excel workbook for free download.

    (more…)

  • Interactive Drop Lines on Microsoft Excel Charts

    Display drop lines to both axis of an Excel chart after clicking on a data point

    Ruler - Photographer Auntie P (flickr.com)The previous post (Tableau Quick Tip #4 – Drop Lines) discussed a great interactive feature for exploring large data sets on charts: the Drop Line.

    In fact I like this feature so much that I am not only using in Tableau. If the data is appropriate, I am also providing a similar feature on my Excel dashboards.

    You may ask:

    “Interactive Drop Lines in Excel Charts? Does Excel provide such a feature?”

    Not built-in, but with a few tweaks and a small piece of VBA code, you can easily get to interactive drop or reference lines in Microsoft Excel, too.

    Today’s post shows how to create interactive drop lines on Microsoft Excel charts for different chart types. As always, the article provides the Excel workbooks for free download.

    (more…)

  • O’zapft is!

    The Development of the Beer Prices at the Oktoberfest – a Tableau Visualization and Analysis

    Oktoberfest Impressionen - Photographer: sanfamedia.com (flickr.com)At this moment Munich’s mayor Christian Ude opens the 179th Oktoberfest in Munich with the traditional shout “O’zapft is” after tapping the first barrel of beer.

    Prior to every Oktoberfest we have a reoccurring heated discussion on the beer price. And – except for the breweries and the tent hosts – we all agree that this year’s “drastic” rise of the beer price is inacceptable.

    No one really takes this discussion too seriously, but we are having it every year.

    So, today’s opening of the Oktoberfest is a good opportunity to have a closer look at the prices and the price development of beer at the Oktoberfest. This article provides an interactive Tableau visualization (beer prices since 2002), followed by an analysis of the price trend since 1952.

    (more…)

  • Web Page Objects on Tableau Dashboards

    Spice up your Tableau dashboard with a web page object showing additional web-based or other external information at your user’s fingertips

    A window too high / Photographer: ephotography (flickr.com)

    Tableau dashboards and all their built–in interactive features are a piece of art on their own.

    However, in certain circumstances (i.e. if your data and visualization is suitable), you can even top this by embedding a web page object into your dashboard and a URL action to hyperlink to additional web–based information outside of your data source, depending on your data and on the user’s selection.

    Google Map views of your geographical data, additional product information from the Internet, websites of other companies, content from your company’s Intranet or even folders and files stored on a file server.

    Today’s post is a step-by-step tutorial how to embed web pages into your Tableau dashboard and update the views depending on user inputs. Furthermore the article includes a couple of real life examples and a discussion of the pros and cons of using this technique.

    (more…)