Category: Microsoft Excel

  • Select Areas on a USA Map in Microsoft Excel

    Interactive radial or rectangular area selection on a map of the United States in Microsoft Excel

    One of the recent posts demonstrated how to mimic Tableau’s rectangular and radial map selection features in Microsoft Excel:

    Selecting and Highlighting Areas on Excel Charts

    The example workbook used a map of Europe. Since more than 40% of my readership is located in the United States, I thought it might be a good idea to also share a template with a map of the USA. Here it is for free download:

    Download Select and Highlight Areas on a US Map (zipped Microsoft Excel 2010 – 2013 workbook, 1.3MB)

    This is an example screenshot of the dashboard:
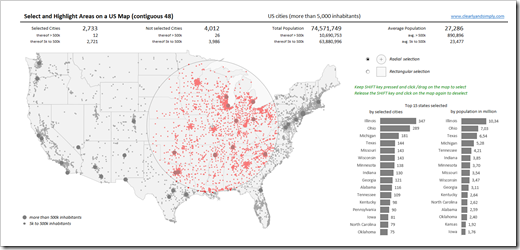
    Interactive Selection on a USA Map in Excel - click to enlargeThe map (the contiguous 48 states, i.e. excluding Alaska and Hawaii) includes all cities in the United States with more than 5,000 inhabitants, divided into 2 categories (greater than or less than 500k inhabitants), visualized with different sizes of the dots.

    To define a radial or rectangular selection (choose with the radio buttons), keep the SHIFT key pressed, click somewhere on the map with the mouse key pressed, move the mouse to span the selection area and – as soon as you are done with your selection – release the mouse key. The metrics above the map and the bar charts (selection statistics by states) right to the map are updated on the fly.

    For more details on how to use the template and how this was implemented in Excel, please have a look at the original post.

    I hope this will be helpful, especially for my friends and readers in the United States.

    Stay tuned.

  • Export Excel Dashboards (Improved Version)

    An improved version of the example workbook exporting Excel Dashboards to other applications

    Improvement - Photographer: Celestine Chua (flickr.com)The previous post provided an example Excel model with the option to export dashboards to other applications and file formats.

    The workbook came with one serious limitation: the PDF and XPS export routine created a separate file for each dashboard, instead of one file with all dashboards.

    In the article I stated, I wouldn’t see how to get around this without using an external PDF creator. It turns out that I simply couldn’t see the wood for the trees.

    It was (again!) Leonid Koyfman, long-time reader and contributor, who pointed me into the right direction. The idea is as simple as it is efficient: create a temporary Excel workbook, copy all dashboards to it (each dashboard on a separate sheet), use the ExportAsFixedFormat method of the workbook object to export the entire workbook (i.e. all dashboards) to one PDF or XPS file and finally close the temporary workbook without saving changes. So simple, so obvious. I should have figured that out on my own. But I didn’t. Many thanks to Leonid for the idea.

    Here is the improved version for free download:

    Download Export Excel Dashboard to other Applications – Improved Version (zipped Microsoft Excel 2010 – 2013 workbook, 210K)

    Stay tuned.

  • Export Excel Dashboards to other Applications

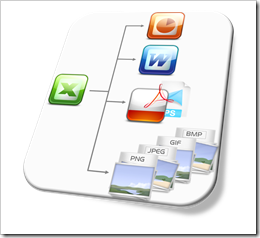
    How to export Microsoft Excel Dashboards to PowerPoint, Word, PDF, XPS or Pictures

    Export Excel to other ApplicationsEarlier this week I received an email from Andrea, one of my few, but faithful readers. Andrea stumbled across a post from 2010 describing how to export Excel dashboards to PowerPoint and asked if I was planning a follow-up post about exporting from Excel to Microsoft Word.
    Truth be told, not up to that point. I personally barely export from Excel at all, but if I do, I usually export to PowerPoint.

    However, I found Andrea’s idea interesting for several reasons: exporting Excel dashboards to other applications and file formats may indeed be helpful, e.g. for creating reports or papers in Microsoft Word. Furthermore the original implementation exported three different dashboards, but the best use case for a bulk export to another application is an Excel dashboard displaying one selected period out of many or a dashboard with various filter options. In this case it can be a real time-saver if you have the option to export e.g. all weekly reports of a quarter or a defined set of filter combinations in one go. Last, but not least, it is actually no big deal to adjust the original code for other applications and file formats.

    Today’s article provides an example workbook which allows to export the dashboards to PowerPoint, Word, PDF, XPS and some picture file formats (PNG, JPEG, GIF, BMP). As always, the post includes a link to the Excel workbook for free download.

    (more…)

  • Cartograms in Microsoft Excel

    How to create Cartograms in Microsoft Excel

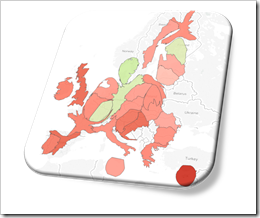
    Cartograms in ExcelThe article Cartograms in Tableau described the limitations of Choropleth Maps under certain circumstances and why Cartograms can sometimes be a viable alternative to color coded maps.

    Building upon that, the previous post (Create your own Cartograms in Tableau) provided a Microsoft Excel tool to create the polygons for Cartograms based on your own data. The Excel tool (called Cartogram Data Generator) is based on my VBA implementation of “an algorithm to construct continuous area cartograms” by J. Dougenik, N. Chrisman and D. Niemeyer, published in “Professional Geographer” back in 1985.

    With this VBA algorithm and two other techniques previously published here (Faster Choropleth Maps with Microsoft Excel and Create Excel Freeform Shapes from Polygons), we have all modules available to calculate and plot Cartograms directly in a stand-alone Microsoft Excel workbook.

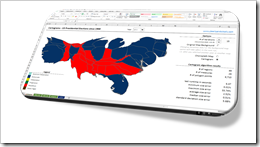
    Today’s post describes how to create Cartograms in Microsoft Excel and provides two versions of the Cartogram workbook for free download.

    (more…)

  • Create your own Cartograms in Tableau

    The Cartogram Data Generator: a free Excel Tool to create your own polygon data for plotting Cartograms in Tableau

    Cartogram EUOne of the recent posts showed how Cartograms can be a viable alternative when Choropleth or Filled Maps are stretched to their limits and tell the wrong overall story:

    Cartograms in Tableau

    The article included a Tableau Public dashboard comparing Filled Maps with Cartograms for the results of the US Presidential Elections since 1900.

    Since Tableau does not provide Cartograms as a built-in chart type, the distorted polygons have to be calculated outside of Tableau and then used as a data source to plot the maps using Tableau’s polygon map approach.

    Today’s article is the follow-up post. It provides a free and open Microsoft Excel workbook to create Cartogram data with a few mouse clicks: copy in the data and the original polygon points of all regions and let the tool create a ready-to-use data set to plot Cartograms in Tableau.

    (more…)