Category: Microsoft Excel

  • Bruce Springsteen Discography in Excel

    A Microsoft Excel Replica of the Tableau Infographic on Bruce Springsteen’s Discography

    Bruce Springsteen at the Austin Music Awards - Photographer: Charlie Llewellin (flickr.com)The recent post presented a Tableau Infographic on the Discography of Bruce Springsteen’s Studio Albums.

    Tableau apparently liked my Infographic and selected it as the Viz of the Day for June 25, 2013 and even incorporated it in the Tableau Public Gallery. I am feeling honored. Thanks, folks!

    I originally planned to directly continue with a follow-up post about how to create and when to use Word Clouds in Tableau.

    On second thought I decided to postpone this follow-up article. I haven’t published anything for more than 6 months and I had a strong feeling I should quickly do something for those of you primarily interested in Microsoft Excel.

    So, if you are waiting for the article on Word Clouds in Tableau, please bear with me. The post will come soon.

    Those of you interested in Excel: this is for you. What would have been more obvious than publishing a replica of the Bruce Springsteen Discography in Microsoft Excel? It goes without saying that the Excel workbook mimics the most interesting interactive features of the Tableau original. As always the article provides the Excel workbook for free download.
    (more…)

  • Create Excel Choropleth Maps from Shape Files

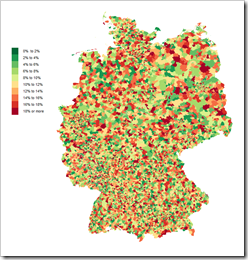
    How to transform Shape Files into Microsoft Excel Choropleth Maps – including 2 Maps of Germany by Zip Codes

    Germany by Zip CodesOn several occasions I thought (and stated) that I already published everything I have to say about Choropleth Maps with Excel.

    Having said that, it seems as if “the ghosts I called I can’t get rid of now”. Recently someone asked me if I could provide an Excel Choropleth Map of Germany by zip codes. Careless and stupid boy I am, I answered “sure this is no problem”. What a misjudgment.

    If you followed my previous Excel Choropleth Map articles, you know that it takes either an Enhanced Metafile of the map you can ungroup in Excel to get the shapes or at least an SVG file to transform it to an EMF file using e.g. Inkscape

    And here is the roadblock I encountered: I simply couldn’t find a map of Germany by zip codes in one of the required formats. All I could find were ESRI shape files. After hours of searching for EMF and SVG files, I gave up, simply reversed my thinking and looked for a tool to convert shape files into SVG. 5 minutes later I had the solution.

    Today’s post describes how to use Indiemapper, a free online tool, to transform shape files into SVG which can then be used for Microsoft Excel Choropleth Maps in the well-known way.

    (more…)

  • Interactive Tooltip Examples

    3 Examples of how to use an ActiveX Spreadsheet Control as a Tooltip on a Microsoft Excel Worksheet

    Prova Riporti - Photographer il Vanzo - tiny little pieces (flickr.com)The recent post described how to use an ActiveX Spreadsheet Control as a tooltip on Excel worksheets. At first sight this seemed to be a nifty little idea to spice up tooltips on Microsoft Excel worksheets. In the meantime, however, I had to learn that there is a major pitfall:

    The heart of the solution, the ActiveX Spreadsheet Control is part of the so called Office Web Components. So far, so good. The problem is that Microsoft does not ship the Office Web Components with Office 2007 and later anymore. In other words, in a clean, new Office 2007/2010 installation, the ActiveX Spreadsheet Control is not available anymore.

    Microsoft still provides the Office Web Components for free download (Office 2003 Add-in: Office Web Components), but there is still a major drawback: if you want to use the described technique, you have to make sure that every user of your workbook either uses Excel 2003 or has the Office Web Components installed.

    At the end of the previous post I announced a follow up article with more practical examples using the technique. Knowing now what I didn’t know before, I pondered if this article would still make sense. To cut a long story short, I finally decided to publish it despite the limitation described above. Maybe some of you will still find it interesting and useful.

    Today’s post provides 3 different use cases of how to take advantage of the ActiveX Spreadsheet Control in a tooltip:

    • a scrollable tooltip
    • side calculations within a tooltip
    • an improved version of the Summary Card tooltip

    As always the articles provides all Excel workbooks for free download.

    (more…)

  • Interactive Tooltips on Excel Worksheets

    The Next Level of Tooltips on Excel Worksheets: Taking Advantage of the ActiveX Spreadsheet Control

    Marchant mechanical calculating machine - Photographer: Ian's Shutter Habit (flickr.com)Tooltips are one of the most helpful features when prospecting large data sets.

    We already had a couple of articles talking about tooltips, on charts and on worksheets:

    Tooltips on Microsoft Excel Tables

    Charts in Excel Table Tooltips

    Display all Fields of a Row in large Excel Tables

    Better Chart Tooltips with Microsoft Excel 2010

    Today’s post is trying to take this to the next level: an interactive tooltip on a Microsoft Excel worksheet. You may ask:

    “What the heck is an interactive tooltip?”

    What I am thinking of is a tooltip enabling you not only to read additional information but also interact with it. E.g. copy data from the tooltip and paste it somewhere else, do side calculations based on the currently selected data, browse through a longer list of data in the tooltip, etc.

    Impossible? No it isn’t. Microsoft provides a very useful ActiveX control which enables us to do exactly this: the Microsoft Office Spreadsheet Control. Today’s post shows how to take advantage of this ActiveX control in order to provide an interactive tooltip on Excel worksheets – as always including the Excel workbook for free download.

    (more…)

  • Roll Over Tooltips and Web Actions on a Microsoft Excel Dashboard

    Bluffing the “Beer Prices at Oktoberfest” Tableau Dashboard with Microsoft Excel using Roll Over Tooltips and Web Actions

    Oktoberfest Impressionen - Photographer: sanfamedia (flickr.com)Recently we had an article visualizing the beer prices and beer price development at Oktoberfest with a Tableau dashboard: O'zapft Is!

    Oktoberfest is long over already and there is peace in the valley of Munich again. Having said that, I would like to come back to this visualization once more. We had a couple of posts here on Clearly and Simply showing how to bluff Tableau’s great interactive features with Microsoft Excel:

    Bluffing Tableau Actions with Microsoft Excel

    Bluffing a Visual Cross-tab with Excel

    The Next Level of Interactive Microsoft Excel Dashboards

    Microsoft Excel Site Catchment Analysis

    Drawing on this tradition, today’s article presents an Excel workbook emulating the Tableau Oktoberfest Dashboard. The technique behind this bluff is a very clever approach my blogging colleague Jordan Goldmeier published in several articles over at his Option Explicit VBA Blog.

    Stealing Jordan’s idea, today’s post shows how to recreate the Oktoberfest Beer Price Tableau dashboard with Microsoft Excel, as always including the Excel workbook for free download.

    (more…)