Category: Dashboards

  • Premier League Historical Statistics

    Interactive Visualization of 15 years of England’s Football Premier League – a non-competitive Contribution to Tableau’s “Interactive Sports Viz Contest”

    Premier League LogoLast week, Tableau announced a new visualization contest: The Tableau Interactive Sports “Viz” Contest.

    Intrigued with the very attractive prices Tableau announced, I would have loved to contribute a workbook. Unfortunately, I am not allowed to, because the contest is open to US residents only.

    If you are a regular reader of this blog, you may have noticed that I love using sports data for my examples. We had several visualizations (Tableau and/or Excel) of Football statistics and even one article using Baseball data:

    Since I am so into visualizing sports data, I decided to publish the workbook I would have contributed to the contest: a Tableau visualization of 15 years of historical data of the English Premier League.

    Today’s article provides the workbook for direct interaction here or for download from Tableau Public. A follow-up post later this week will describe step-by-step tutorials of some of the most interesting techniques I used for the implementation.
    (more…)

  • Range Filter Slider Control in Microsoft Excel

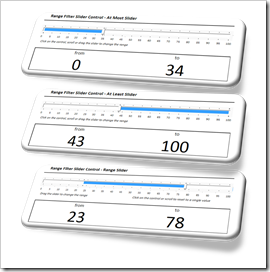
    How to use the Microsoft Slider Control to implement a range filter input feature in Microsoft Excel

    Intro Microsoft Slider ControlAlmost every Excel workbook needs some way of user interaction (maybe except for the Excel models serving solely as the reporting front-end of a database). The users changes parameters, sets filters, triggers actions and so forth.
    The most common way of user interaction in Excel is directly typing in values in a cell. Form controls like scrollbars, spin buttons, radio buttons, combo boxes, etc. are the next step of more convenient interactivity. ActiveX controls provide more flexibility than form controls, but they come with there own disadvantages and usually form controls are the way to go.

    However, there is one use case that cannot be covered with a standard Excel form control: selecting a range. Frequently required, especially for filtering data, e.g. a reporting period or products within a certain price range, etc.

    Sure, you can define 2 input cells, 2 spin buttons or 2 scrollbars to let the user select a range.Though, there is no standard Excel form control to select a range within one single control.

    However, Microsoft provides a less known ActiveX control to select a range. Today’s article describes a how-to tutorial on using the Microsoft Slider Control in Microsoft Excel workbooks. As always, including the Excel workbook for free download.

    (more…)

  • The Next Level of Interactive Microsoft Excel Dashboards

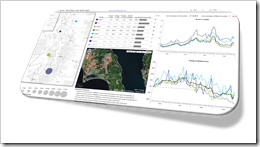
    A highly interactive Microsoft Excel Replica of Tableau’s Seattle Real Estate “Around the Sound” Dashboard

    Around the Sound Dashboard - IntroA couple of weeks ago I had the privilege to contribute to Chandoo's great Excel School. Chandoo and I discussed Excel dashboards in general and how to add interactive features. If you are subscribed to the dashboard module of Chandoo's Excel School, you will soon be able to watch the whole interview.

    Prior to our discussion, I prepared a simple interactive dashboard based on an example taken from the Tableau Software Visual Gallery: Around the Sound – Seattle Real Estate Prices. After our interview, I spent some more time with the model and enhanced this dashboard with more analytical features.

    We already had a post discussing interactivity on Excel dashboards: Bluffing Tableau Actions with Excel. However, the model I developed subsequent to my discussion with Chandoo includes more, hopefully helpful functionality. Thus, I thought you might be interested.

    Today’s post describes the enhanced model and provides the Excel workbook for free download. 

    (more…)

  • Excel Multiple Value Filters with Invert Selection

    How to enhance a multiple value filter check box control with an invert selection option in Microsoft Excel

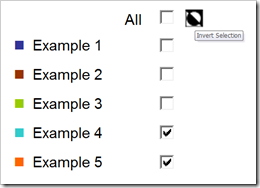
    Invert SelectionThe comments and emails I received on the recent post Excel Dashboard Controls – Multiple Value Filters reinforced my conclusion that the original idea of providing a feature to switch back to a previous selection is more confusing than helpful.
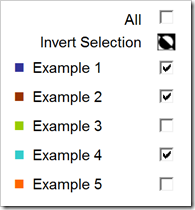
    However, there is another option to really improve the functionality of multiple value filters. Leonid, one of my few but faithful readers was kind enough to share a very interesting idea: add an additional input feature to let the user invert the actual selection.

    Leonid provided 2 different solutions. Number 1 is a simple inversion symbol with additional explanatory text. Clicking on the symbol inverts the actual selection of filters:

    Invert Selection V01

    The VBA code triggered when clicking on the symbol is straight forward:

    Sub InvertFilters()
    Dim rng_cell As Range
        For Each rng_cell In Range("myActualFilter")
            rng_cell.Value = Not rng_cell.Value
        Next rng_cell
        Range("myCheckBoxAll").Value = _
                 Application.WorksheetFunction.And(Range("myActualFilter").Value)
    End Sub

    The code simply inverts all target values of the check boxes from TRUE to FALSE and vice versa.

    Here is the workbook for free download:

    Download Multiple Value Filter Control with Invert Selection v01 (Microsoft Excel 2003, 91K)

    If the additional row bothers you, you may want to look at Leonid’s alternative option: use a hyperlink on the symbol to provide a tooltip (”Invert Selection”):

    Invert Selection V02

    There is an additional cell and some more code necessary (on the dashboard worksheet), but the implementation is still pretty straight forward. Here is the workbook:

    Download Multiple Value Filter Control with Invert Selection v02 (Microsoft Excel 2003, 96K)

    Leonid, many thanks for sharing your ideas here and for your workbooks. Your contributions are highly appreciated.

  • Excel Dashboard Controls – Multiple Value Filters

    How to create a multiple value filter control including a “select all / none” option with Microsoft Excel

    Multiple Value Filter Control

    If you ever built interactive Microsoft Excel dashboards, I am betting the ranch that there was at least one with some kind of interactive filtering features. For selecting one out of several categories you probably used a drop down list (i.e. a combo box). If you need a multi filter control (i.e. selecting several categories) a multi select list box or several check boxes are the way to go. We had that before: In one of the first articles on this blog I already showed different techniques of how to implement a multi-select control feature on Microsoft Excel dashboards (Approach with Caution).

    So far, so good. However, what I didn’t discuss in that article is one obvious requirement you may have for a multiple value filter control on a dashboard: an option to let the user easily select all or none categories with one single mouse click. Especially helpful if you are having a lot of categories.

    Today’s post tries to fill this gap: this article shows several options of how to implement a multiple value filter control based on check boxes, including an additional check box to easily select and deselect all categories. As always, the post provides all Excel workbooks for free download. 

    (more…)