FIFA World Cup scorers statistics by team and tournament from 1930 to 2006 visualized with Tableau Software
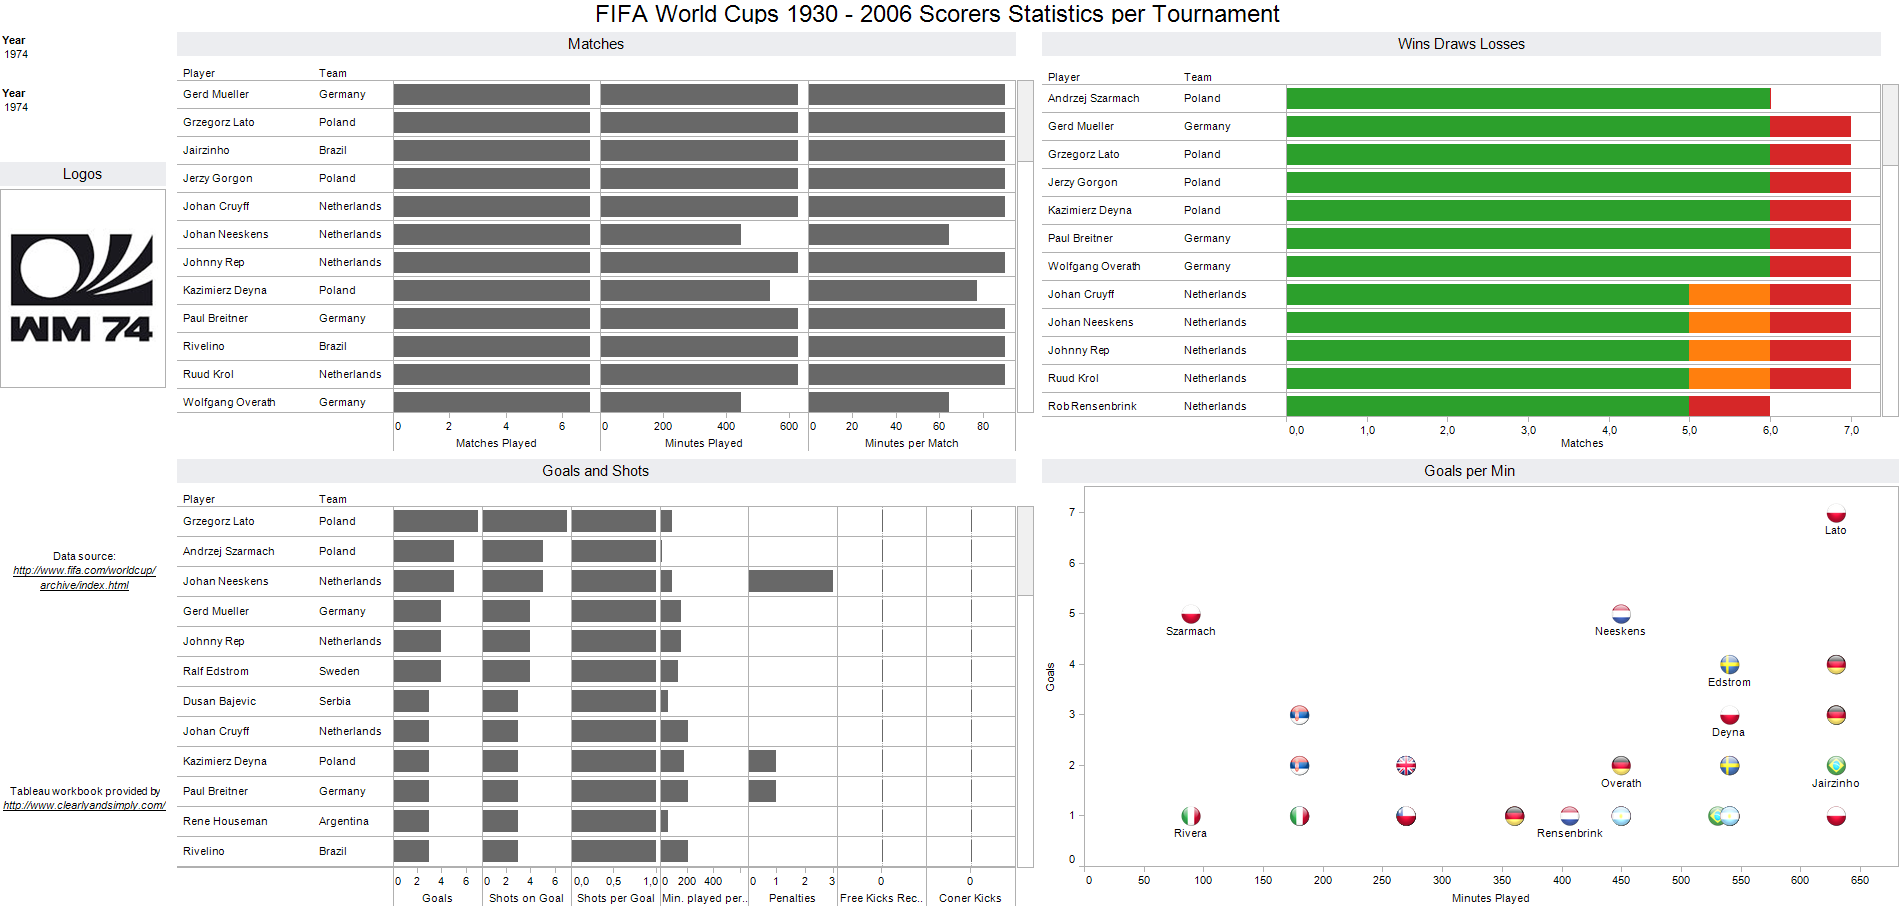 The recent article FIFA World Cup Statistics with Tableau included a dashboard visualizing statistics of the FIFA World Cups from 1930 to 2006 by team, provided on Tableau Public.
Today’s post is a follow-up to that article: FIFA World Cup scorers statistics from 1930 to 2006 on two different dashboards.
The data source
The scorers data is coming from the same source I already used in the previous article: the official website of the FIFA: FIFA.com – Previous FIFA World Cups™
Dashboard 1: Scorers Statistics per Team
This dashboard visualizes the scorers’ performance of one selected team during one or several tournaments:
- select one team from a drop down list and one or several tournaments
- visualize matches played and minutes played per player (scorer) using sorted bar charts
- visualize the wins, draws and losses per scorer using a sorted stacked bar chart
- visualize different measures regarding goals, shots, corners, etc. per scorer (bar charts again)
- visualize activity (shots vs. minutes played) and effectivity (goals vs. minutes played) of scorers using scatter charts
Here is the dashboard:
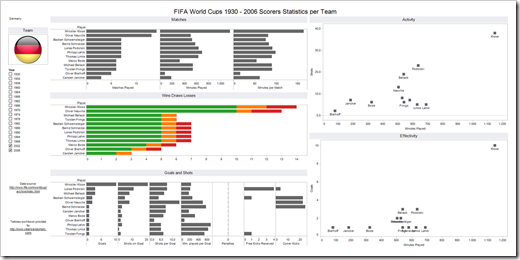 [click on the image to open the interactive visualization on Tableau Public]
Dashboard 2: Scorers Statistics per Tournament
This dashboard uses the same data source, but it slices the data in a different way: the global filter is the tournament now, i.e. the visualizations compare all scorers of all teams for one selected FIFA World Cup. After selecting one tournament from a drop down list, the dashboard displays the same measures using the same types of visualizations as on dashboard 1 (except for the activity scatter plot). This time however, all scorers of all teams are shown, including the team names.
Here is the dashboard:
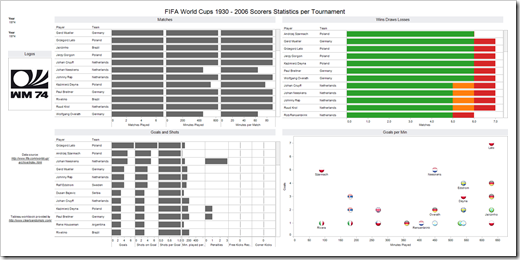
[click on the image to open the interactive visualization on Tableau Public]
The Limitations
Please be advised that the limitations (incomplete data source, consolidated team names, missing flags) described in the previous article also apply to the 2 dashboards above (details see here: FIFA World Cup Statistics with Tableau).
What’s next?
I am still planning to write one or two posts on Custom Shapes of Tableau. However, the FIFA World Cup 2010 is still ongoing, so I am a tempted to do another football visualization first.
Stay tuned.