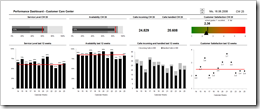
A Showcase: 5 steps of Performance Dashboard Design
 Using Key Performance Indicators (KPIs) in Customer Care management is a prime example of Performance Dashboards. Call Center Managers usually monitor the performance of their Customer Care with an extensive list of different metrics and KPIs visualized on one or several real-time dashboards. On a higher level and in a more condensed form the numbers are also reported to the Top Management on regular intervals, usually at least weekly.
Against this background, this post describes 5 steps of designing an Executive Customer Care Performance Dashboard, including an example file for free download.