Author: Robert

  • Excel Dashboard Controls – Multiple Value Filters

    How to create a multiple value filter control including a “select all / none” option with Microsoft Excel

    Multiple Value Filter Control

    If you ever built interactive Microsoft Excel dashboards, I am betting the ranch that there was at least one with some kind of interactive filtering features. For selecting one out of several categories you probably used a drop down list (i.e. a combo box). If you need a multi filter control (i.e. selecting several categories) a multi select list box or several check boxes are the way to go. We had that before: In one of the first articles on this blog I already showed different techniques of how to implement a multi-select control feature on Microsoft Excel dashboards (Approach with Caution).

    So far, so good. However, what I didn’t discuss in that article is one obvious requirement you may have for a multiple value filter control on a dashboard: an option to let the user easily select all or none categories with one single mouse click. Especially helpful if you are having a lot of categories.

    Today’s post tries to fill this gap: this article shows several options of how to implement a multiple value filter control based on check boxes, including an additional check box to easily select and deselect all categories. As always, the post provides all Excel workbooks for free download. 

    (more…)

  • Microsoft Excel Site Catchment Analysis (Part 2)

    Techniques to implement the Site Catchment Analysis of Germany in Microsoft Excel
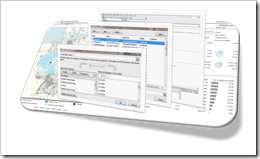
    Site Catchment Dashboard IntroI am sure you are already fed up with articles on Site Catchment Analysis here. I swear it was not my intention to have such an avalanche on this topic here. But it turned out to be a very good example to demonstrate different interesting ideas in Tableau and Excel. After using this example for a how-to tutorial on Calculated Fields in Tableau, I wrote an update for Tableau 6 (Site Catchment Analysis with Tableau 6) and Richard Leeke was kind enough to provide a fabulous guest post series (part 1, part 2, part 3) with excellent insights on how table calculations work in Tableau, also based on the Site Catchment showcase. I finally couldn’t resist to use the example again and showed how this would look like in Microsoft Excel: Microsoft Excel Site Catchment Analysis (Part 1). Since the Excel model is quite a complex workbook, I decided to split this up again into a 2-post series.

    So, please bear with me, I have to bring this to an end now. Today’s post provides some more details on the Site Catchment Analysis of Germany with Microsoft Excel.

    (more…)

  • Microsoft Excel Site Catchment Analysis (Part 1)

    The Microsoft Excel version of the Site Catchment Analysis of Germany including the calculation of the optimal center

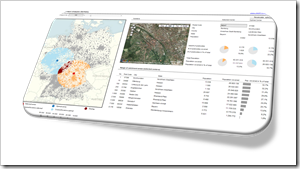
    Site Catchment Analysis DashboardIn October 2010 I used a show case of a site catchment analysis of Germany to demonstrate the power of Calculated Fields in Tableau. During the weeks that followed we had quite an avalanche of follow-up posts on this article: Site Catchment Analysis with Tableau 6 described an upgrade of the original workbook to the new version 6 of Tableau, including the roadblocks I hit during the upgrade. In a fantastic guest post series called “Another Look at Site Catchment Analysis with Tableau 6” (part 1, part 2, part 3), Richard Leeke showed how to overcome most of the disadvantages in my implementation.

    I suspect you may already be fed up with this example. Despite the risk of boring you, I decided to stay a little longer with this topic, mainly for the following 3 reasons:

    • The use case turned out to be a very interesting and yielding example for the discussion of features, techniques, workarounds and performance facets of Tableau Software. I guess everything has been said (especially by Richard) with regards to Tableau. But what about Microsoft Excel?
    • Furthermore, finding data points within a certain radius from a given center has many more use cases than just a site catchment analysis. You may analyze sales performance KPIs, customer behavior or logistical statistics within a certain area. I am convinced, a Microsoft Excel version of the site catchment analysis can be very useful for some of your analyses of geographical data.
    • Last, but not least, the Tableau implementation allowed to display the results of any user selected postcode, but it lacked a feature to calculate the optimal center of any given radius. A task tailored for Microsoft Excel.

    Thus, today’s article will provide a Microsoft Excel workbook to conduct a site catchment analysis and to compare the results of the optimum with any given center, including some nice interactive features on the dashboard. As always the Excel workbook is provided for free download.

    (more…)

  • Another Look at Site Catchment Analysis with Tableau 6 (Part 3)

    Techniques to Get Past the Limitations – Part 3: Performance Tips and a Wish List

    © halmackenreuter / pixelio.deThis is the third and final part of a guest post series by Richard Leeke from Equinox Ltd.

    The first two articles of this series focused on three different techniques for doing different levels of aggregation with Tableau: Table Calculations, Data Blending and Parameter Lookup Tables.

    However, these articles only discussed one of the caveats raised in Robert’s original Site Catchment Analysis with Tableau 6. I can’t do anything about the second – missing functionality of triggering an action after the change of a parameter. But in this article I discuss the various techniques I used to optimize the performance of the Tableau workbook. Whilst the discussion focuses on the Site Catchment Analysis discussed in this series, there are several that are general hints which may apply to lots of your Tableau workbooks. I actually only worked out a couple of these while working through this analysis, but have already adopted them in other workbooks with great success.

    So, today’s article wraps up my guest post series with a couple of tips to increase Tableau’s performance and (especially for the Tableau folk reading this blog) a little wish list for future versions of Tableau.

    (more…)

  • Another Look at Site Catchment Analysis with Tableau 6 (Part 2)

    Techniques to Get Past the Limitations – Part 2: Data Blending and Parameters for Lookups

    © Niko Korte / pixelio.deThis is the second part of a guest post series by Richard Leeke from Equinox Ltd.

    The first part of this series described one approach to overcoming the restrictions in Robert’s Site Catchment Analysis with Tableau 6, in this case using table calculations. If you look at the roadblocks Robert has described in his approach, table calculations are probably the first idea that comes to your mind if you are trying to overcome the issues. But whilst that approach achieves the analytical outcome Robert was seeking, it does not get the workbook back to the performance Robert had achieved with version 5.2.

    However, there are other options, too: you could either use data blending or even a nifty little trick to let parameters do the required lookups. Each of those techniques makes the workbook quicker, as I explain below. Each of the three approaches comes with its own pros and cons, but all of them are well worth having a closer look.

    Today’s article describes those 2 alternative approaches and again provides the Tableau workbook on Tableau Public and for free download.

    (more…)