Plotting preprocessed polygon data as Cartograms in Tableau: the results of the US Presidential Elections since 1900
 Choropleth Maps or Filled Maps (as they are called in Tableau) are a great technique for analyzing geographical data, especially for maps with a high level of detail (e.g. US by counties or ZIP codes). They make it very easy to identify geographical hot spots first and then drill down into these regions using other visualization types.
Having said that, they also have their limitations and disadvantages. Even worse, under certain circumstances Choropleth Maps can be misleading and visualize the data incorrectly.
A classic example of misleading Choropleth Maps are the well known US Presidential Election Maps. We all have seen them, right? A map of the USA with color coded states: a red fill color if the Republican candidate won the state and a blue fill color if the Democratic candidate won (and in some years other colors for independent candidates).
Although these maps correctly depict the geographical distribution of “who won where”, they are usually telling the wrong overall story.
How come?
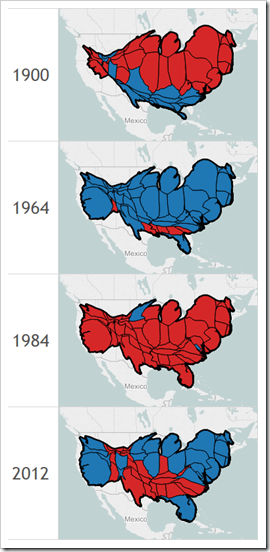
Traditionally Republicans very often win some of the larger states with a small population density like Alaska, Montana and Wyoming (and thereby only a small number of electoral votes). As a consequence red often dominates the color coding of the map, even if the Democratic candidate won the entire election.
Cartograms are a geographical visualization on a map avoiding this problem. Cartograms are distorting the map by resizing its regions according to e.g. the population, the popular votes or the electoral votes, At the same time the Cartogram algorithm tries to retain the topology of the map as far as possible.
Today’s article presents a dashboard on Tableau Public comparing a Filled Map with a Cartogram for every US Presidential Election since 1900.
 If you are a regular reader or even subscribed to this blog, you will not be surprised to hear that I am working on a new challenge regarding maps in Microsoft Excel.

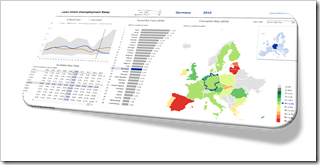 Very often, a dimension is displayed on more than one view of a dashboard.
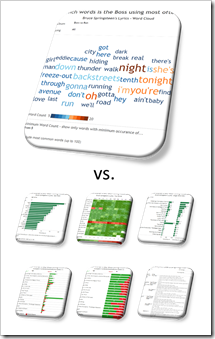 The previous two posts (