How to create a Microsoft Excel dashboard to monitor the progress of a software development project (part 2 of 3)
 This is the second part of a 3 post series on software development project dashboards with Microsoft Excel. Episode 1 of the series discussed a dashboard to monitor the software defect statistics. Today’s article addresses to another very relevant facet in a software development project: The progress and success of testing.
Testing as the process of validating and verifying quality and suitability of the developed system is at least as important as the number of defects detected. Actually, it goes without saying that testing is the prerequisite of finding software defects. Having said this, it probably would have been better to start the series with this part, but I recognized this too late. My bad.
Anyway: Today’s post provides a minimalist dashboard to monitor test progress and test success within a software development project. As always including the Microsoft Excel workbook for free download.
The Challenge
Create a one-page dashboard for monitoring the actual status of the test progress and test success in order to have a quick overview of the test coverage at a glance. A dashboard that can be used in an overall project reporting as well.
The Key Performance Indicators
According to Wikipedia software testing is
“… an empirical investigation conducted to provide stakeholders with information about the quality of the product or service under test, with respect to the context in which it is intended to operate. […] Test techniques include, but are not limited to, the process of executing a program or application with the intent of finding software bugs.”
Of course there are different types / phases of software testing like system tests, global integration tests or user acceptance tests. However, all these types probably have some KPIs in common:
- Test scope
Before starting the test, you usually define the test scope. i.e. you determine and document all test cases to be conducted (in our example 2,500 test cases in total). - Test cases planned over time
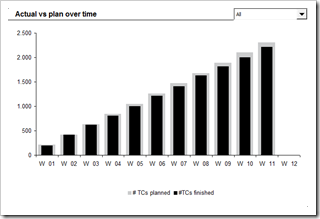
The test scope (see above) is planned over time, usually based on the availability of resources, the complexity of test cases, etc. For reasons of simplicity, I uniformly distributed the total test scope over the 12 weeks testing period in this example. - Test cases started and test cases finished
In complex software projects, there will probably be some test cases that cannot be finished at the same day they have been started. E.g. some test cases have to wait for documents or results coming out of other system environments like invoices, etc. Hence we have to divide the test cases started into test cases not yet finished and test cases finished. - Test cases passed and test cases failed
A test case may either pass, i.e. be finished without any defect (“test case passed”) or fail, i.e. test cases that end with one or several defects or hitting a road block like a design gap (“test case failed”). - Success rate
The success rate is defined as the number of successfully conducted test cases (“passed”) in percentage of all test cases finished. Defining a target success rate (87% in the example) is definitely not mandatory since the people conducting the test (Quality Assurance or the business units) do not have any influence on the quality of the software. However, I recommend to monitor the success rate because otherwise – from my point of view – you will have no clear overview of how much of the system has really been fully tested. - Completion rate
The completion rate is defined as the number of finalized test cases (either passed or failed) in percentage of the total number of test cases planned (test scope). - Actual in % of plan
With the KPI “actual in % of plan” you monitor the test progress. This KPI helps you to evaluate whether or not you will be able to conduct all test cases defined in the test scope within the given time frame.
The Visualizations
-
Actual test progress and success rates by software module for the selected week
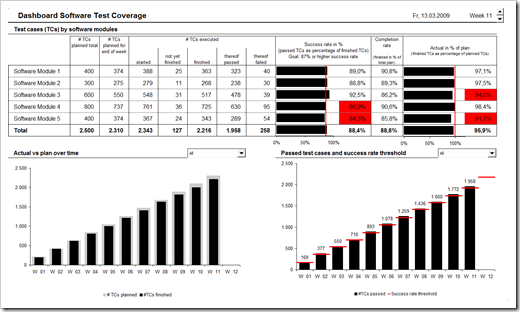
The snapshot of the actual test progress and test success rates is presented in a combination of a simple table by software module and two additional bar charts with target lines: The main KPI like total number of planned test cases, planned test cases for the actual week, test cases started, etc are displayed within the table as raw numbers. The bar charts with target lines and enhanced by highlighting critical numbers with a red fill color give a quick overview of the test success rates and the test progress (actuals in % of plan).
In this example, the total scope of the test is divided by software modules or applications. Depending on the type of test you are conducting, this may differ. In a user acceptance test, for one, you may divide the test scope by the business units conducting the tests.
-
Development of the success rate
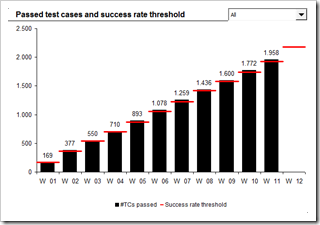
Another column chart with red target lines displays the success rates of testing over time, i.e. the number of successfully conducted test cases compared to the predefined success rate (87% in this example). Again, the user of the dashboard is enabled to see one selected software module or the development in total.
The Implementation
The structure of the workbook is exactly the same as it was in the workbook provided with Episode 1, the software defect monitor dashboard.
The formulas used to consolidate the input data on the worksheet “control” use some more complex functions like SUMPRODUCT and INDEX, the formula calculating the ISO 8601 week numbers (explained here) and a couple of simple IF THEN clauses and rounding functions. Advanced Excel skills, but nothing new under the sun.
The implementation of the dashboard isn’t too complicated as well:
- Tables directly linked to the results on the worksheet “control”
- A spin button to “walk through the weeks”
- Conditional formatting to highlight critical success rates or completion rates in red
- Two bar charts with a target line. Jon Peltier provides a step by step tutorial how to do this
- 2 combo boxes to select one specific software module to be displayed in the column charts
- A “thermometer column chart”, i.e. using two columns with different widths and a 100% overlap
- A column chart with a target line per column, using a combination chart of columns and an XY scatter with horizontal error bars. Of course it is again Jon Peltier who has the best how-to tutorial for this technique. Many thanks Jon!
The Result
As already shown in the introduction to this post, here is the final result, a screenshot of the test progress dashboard:
As always, here is the Microsoft Excel workbook for free download:
Download Dashboard Software Test Progress (Excel 97 – 2003, 270K)
All data in this workbook is made up.
What’s next?
A big threat to software development projects are change requests, i.e. the call of business departments or the software development itself for adjustments of the system’s scope respectively the technical design documents. The final part of the series will suggest a Microsoft Excel dashboard to monitor the development of change requests during a software project.
Stay tuned.


Leave a Reply