How to add a dynamic, interactive sorting feature to your Tableau Dashboard. The first article of a guest post series on “Expand your reach in Tableau with Parameters”
") To me, one of the most interesting sessions of this year’s Tableau Customer Conference was “Tips & Tricks from the Wild”, where five Tableau champions presented some of their best techniques in Tableau. One of these exceptional Tableau experts is Sheel Bhatiani, Lead Software Developer at Cheyne Capital. I liked his tip so much that I asked if he would be so kind to share some of his tricks here on Clearly and Simply. I am very happy to inform you that Sheel not only agreed to write one guest article here, but rather to publish a whole series of posts on how to “Expand your reach in Tableau with Parameters”. Sheel kicks off his series with today’s article. Enjoy.
To me, one of the most interesting sessions of this year’s Tableau Customer Conference was “Tips & Tricks from the Wild”, where five Tableau champions presented some of their best techniques in Tableau. One of these exceptional Tableau experts is Sheel Bhatiani, Lead Software Developer at Cheyne Capital. I liked his tip so much that I asked if he would be so kind to share some of his tricks here on Clearly and Simply. I am very happy to inform you that Sheel not only agreed to write one guest article here, but rather to publish a whole series of posts on how to “Expand your reach in Tableau with Parameters”. Sheel kicks off his series with today’s article. Enjoy.
Parameters – introduced with Tableau version 6 – are dynamic values that replace constants in calculations. They can be changed by the user of a dashboard or worksheet with an interactive control. This opens a lot of opportunities. Parameters in combination with Calculated Fields enable you to add a whole variety of additional interactivity to your Tableau workbook and dashboard. One of the most interesting things about Parameters is their ability to bring the existing Tableau built-features to the next level.
Today’s first article of my post series here shows the main concept of how to do this and includes a detailed tutorial how to use this for implementing a user-friendly interactive control to change the sort measure and the sort order of a view on a dashboard: Dynamic sorting with Tableau at your fingertips.
Are you ready to expand your reach in Tableau with Parameters? Here you go.
The Background and the Idea
Let’s take the Superstore Sales sample data coming with each Tableau installation and create a very simple view like this:
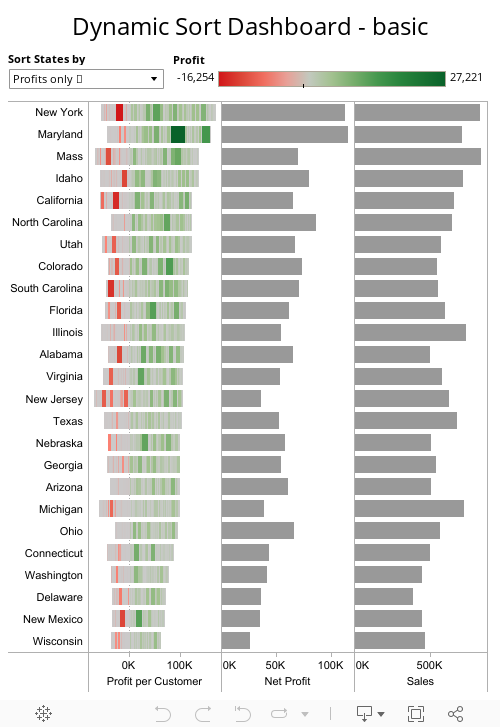
 A list of Customer States visualizing Net Profit and Sales with simple bar charts and Profit per Customer with a color coded tornado chart. You certainly know how to do this. Using the Multiple Marks feature, you put [Customer Name] on the Level of Detail Shelf and [Profit] on the Color Shelf for the tornado. No big deal.
Very often, analyzing data starts with sorting by different measures. And of course, Tableau provides different built-in ways of sorting your views: the one-click-sort using the sort buttons on a worksheet or dashboard or the persistent sort which allows you to sort by data sort order, alphabetic, by field or manually. However, sometimes the built-in features just ain’t enough.
The easiest way is selecting one measure by clicking on the axis (e.g. Net Profit) and then using the sort buttons on the Tableau toolbar. This works well for all three bar charts. However, sorting by Profit per Customer will sort the States by the total net profits. In other words, it will result in the same sort order as sorting by Net Profit. This works as designed, but what if you want to sort the view by profits only or losses only? Something like this:
 Of course this is possible with Tableau in general.
First, you need two simple Calculated Fields:
[Profits only] : MAX([Profit],0)
and
[Losses only] : MIN([Profit],0)
Finally you set the sort order of [Customer State] to Sort by Field and select either [Profits only] or [Losses only].
However, this is only possible on the worksheet, not on the dashboard. And it is inconvenient to change the sort measure and sort order of the view this way. Wouldn’t it be nice, if you would be able to change the sort measure and the sort order with a convenient and easy to access interactive control directly on the dashboard?
Parameters and some more Calculated Fields allow you to easily implement such an additional interactive sorting control.
Here is the detailed how-to tutorial:
The basic approach – A step-by-step tutorial
The basic approach needs only one Parameter and one Calculated Field for an interactive dynamic sort feature.
Step 1: Create a Parameter
Right click somewhere on the data window and select Create Parameter. In the following dialogue window, give the new Parameter a meaningful name like “Sort States by”, select String as the data type of the Parameter and enter names for all measures in the list of values table. Since we have only one Parameter to select both the sort measure and the sort order, you have to add two entries to the list for each sort measure and an additional description to represent the sort order. You could simply add “ascending” and “descending” to the measure names or – as shown in the following screenshot – you may also use symbols like triangles (triangle up for ascending, triangle down for descending):
 Step 2: Create a Calculated Field for the Sort Measure
Next, right click again on the data window and create a new Calculated Field. The formula is a simple CASE WHEN statement. It evaluates the Parameter created in step 1 and assigns the according (i.e. user selected) measure to this Calculated Field. To switch from the default ascending to a descending sort order, we simply set the measure to its negative value.
The Calculated Field looks like this:
 Please be careful: the texts in this Calculated Field used after the WHEN statements have to be exactly the same as you defined them when creating the Parameter (see step 1).
Step 3: Set the Sort Order of the dimension on the Row Shelf
Click on the arrow of the [Customer State] pill on the Row Shelf and select Sort. In the following dialogue window, click on Sort by Field and select the Calculated Field created in step 2 ([State Sort Measure]):

Step 4: Show Parameter Control
Finally, right click on the Parameter [Sort States By] in the data window and select Show Parameter Control.
That’s it.
Only 4 steps and you have an additional drop down list to change the sort measure and sort order of your view in one go.
Here is the interactive version on Tableau Public:
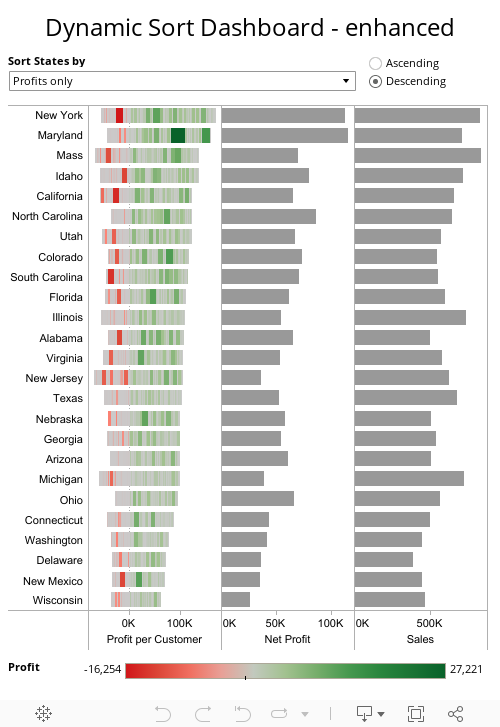
The enhanced version
The idea of the enhanced version is obvious: Instead of having two entries for each measure in the drop-down list of the Parameter, we add another Parameter to select the sort order.
Step 1: Create a Parameter for the Sort Measure
Pretty much the same step as in the basic approach, but only one entry per measure in the list of values:
 Step 2: Create a second Parameter for the Sort Order
This is a new step. Create another Parameter, again with data type String, but only with two entries in the list of values: ascending and descending. We call this Parameter [Sort Order]:
 Step 3: Create a Calculated Field to transform Text Fields to Numbers
Another additional step is necessary. Since we want to sort the view ascending or descending not only by [Profit] and [Sales], but also by [Customer State Name], we have to transform the names of the state into a number.
Here is one possible way of doing this: A new Calculated Field ([State String Number]) converts the first 4 characters of the state names to a number using the function ASCII. Multiplying the characters by decimal powers and adding them results in a four-digit number which we can use for sorting the state names.
 Agreed, this is a brute-force method. However, it works, at least in most cases. Please be advised that this technique will not work 100% correctly, if there are state names starting with the same 4 characters (e.g. North Carolina and North Dakota). But it is close enough for this example.
Step 4: Create a Calculated Field for the Sort Measure
This step is pretty much the same as step 3 of the basic approach, but the calculation is different. It is a CASE statement based on the Parameter [Sort States by] again, but please notice the additional IF-clauses within each WHEN statement. Furthermore we have to use aggregations (SUM and AVG) in order to make the formula work for sorting the state names:
 The CASE statement is pretty complex, including IF THEN statements within each WHEN. If you find this too hard to read and understand, there is another way to simplfy this Calculated Field.
Create another Calculated Field and call it – let’s say – [Sort Sign]:
IF [Sort Order] = “Ascending” THEN
1
ELSE
-1
END
You can now simplify your formula of [State Sort Measure]:
 - click to enlarge") The result is exactly the same. However, you transferred the repeated IF THEN statements to another Calculated Field and simplified the CASE statement. This is probably easier to read and understand.
The result is exactly the same. However, you transferred the repeated IF THEN statements to another Calculated Field and simplified the CASE statement. This is probably easier to read and understand.
Step 5: Set the Sort Order of the Dimension on the Row Shelf
This one is exactly the same as step 3 of the basic approach.
Step 6: Show Parameter Controls
Again the same procedure as in step 4 of the basic approach, but this time you show both Parameter Controls: [Sort States by] as a compact list again and [Sort Order] as a single value list (radio buttons).
That’s it. Two simple steps more than the basic approach and you are good to go.
Here is the interactive enhanced version on Tableau Public:
The Drawbacks
The technique described above is a workaround. No more, no less.
Like any other workaround, it comes with some limitations and pitfalls. It takes some additional time to implement it (not too much in this case, though) and you have to define the sorting measures in advance. Those are only minor drawbacks from my point of view.
However, you should be aware of a more serious shortcoming of this technique. It only works as long as you or the user of your dashboard doesn’t change the sort order by using Tableau’s built-in sorting. After you selected a field and sorted it with the sort buttons on the toolbar, our dynamic sorting technique does not work anymore.
The root cause for this is the fact that Tableau sets the sort order to manual, if you are using the toolbar sort buttons. In this case, you have to go to the worksheet again and set the sort order of the dimension on the Row Shelf to Sort by Field again.
It goes without saying that the technique described above also stops working if you change the persistent sort on the worksheet to sort by data source order, alphabetic sort, another field or to manual sort.
As long as you are aware of this undesired behavior, you might be ok. However, this could be confusing for a user who does not know about this shortcoming. Even worse, if he has only access to the dashboard, but not to the worksheet (e.g. if he is using Tableau Reader or a dashboard on Server or Public), he can’t do anything about it.
There is one more drawback you should be aware of: using the Calculated Field as the sort criterion results in a more complex query and this may have negative impact on the database performance. If you encounter this problem in your implementation, you could grab the generated query from your Tableau Desktop log file and tune this with your DBA.
What’s next?
This was the first post of a series of articles on how to expand your reach in Tableau with parameters and to spice up your Tableau dashboards with even more dynamic, interactive features than Tableau already provides as a standard.
The next article will show a similar technique to create an interactive hierarchy.
Stay tuned.
Leave a Reply to Lars Nordin Cancel reply