How to export a Microsoft Project Gantt Chart to PowerPoint
 The recent post Bring your tasks in a row showed a way of how to import a project plan from Microsoft Project into a preformatted Microsoft Excel template with ease. Today we are taking the opposite direction. This post provides a tool to export a project plan from Microsoft Project. This time however the target application is not Microsoft Excel. It is Microsoft PowerPoint. And I am not talking about a simple macro that copies the project plan as a picture and pastes it into a PowerPoint slide. The tool converts an mpp-file into a full editable Gantt chart in Microsoft PowerPoint with one single mouse click. On the fly.
What does it do?
A simple question, a simple answer:
You have a project plan in Microsoft Project like the one shown in this screenshot:
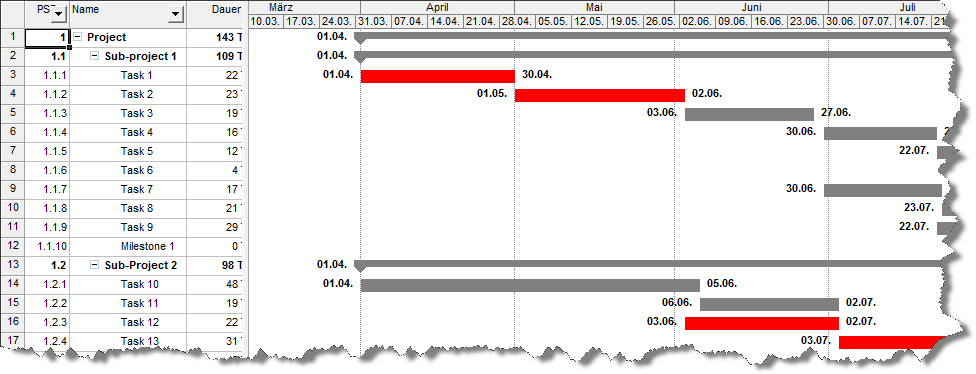
With one mouse click the tool converts your project plan into a PowerPoint file like this:
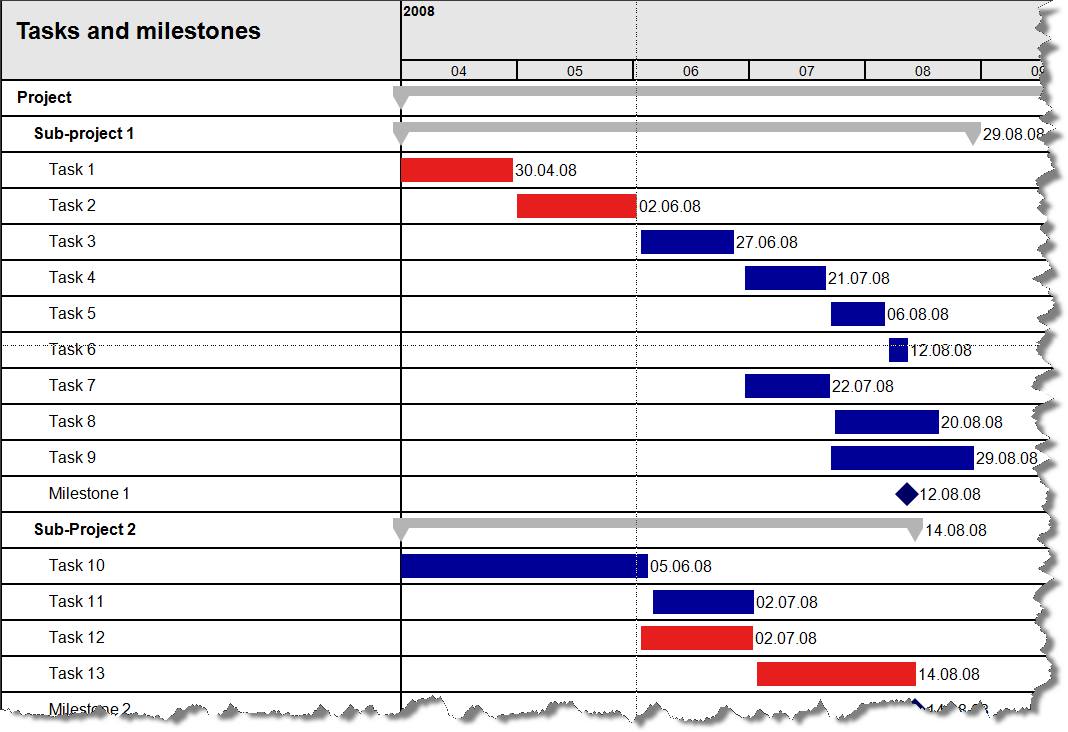
To be crystal clear: This is not a picture. In fact it is a set of PowerPoint objects like textboxes, rectangles, triangles and diamonds. You can format, align, rearrange, group and resize them, add annotations, delete single items, etc.
What is it good for?
From my point of view there are 3 main use cases for this little tool:
- Export your project plan or parts of it and use the slides in your project status report, steering committee or team meeting presentations.
- Provide your team members with the actual project plan in a different format than mpp. You can use the tool for this as well, but I would recommend to import the project plan into Microsoft Excel.
- If you don’t have a project plan to export, but rather need a simple Gantt chart slide in Microsoft PowerPoint, it is more convenient and time saving to create a Gantt with Microsoft Project, export it to PowerPoint and edit it there according to your requirements.
What functions does the tool provide?
When opening the tool and enabling macros, you will notice an additional menu in the main menu bar called “Export to PPT”. This menu provides 3 functions:
- Export All To PPT
This function exports the whole project plan to PowerPoint.
- Export overview (first and second level) to PPT
This function exports only the first 2 outline levels of the project plan, i.e. tasks and milestones with a WBS code like 1. or 1.1. will be exported, tasks with a WBS 1.1.1, etc. will not be exported. This function comes in handy if you want to create an overview Gantt chart in PowerPoint.
- Export selected tasks and milestones to PPT
This function exports the actual selection. You can select rows in Microsoft Project by clicking on the row header. Keeping the CTRL-key pressed allows you to select non-continuous ranges as well. This function is very useful if you want to export a subproject or a couple of selected milestones.
What do you have to do?
You have two different options to use the tool:
- Delete all existing dummy data in the download file and copy your own project plan into this file.
- Open the tool and the mpp-file with your project plan. Go to the VBE (ALT-F11) and copy the module ‘basExportToPowerPoint’ to your file (drag and drop) and copy the VBA code of the object “This project” to the according object of your file (cut and paste). Save and close your mpp-file, open it again and enable macros.
That’s it.
What are the limitations?
- Smaller inaccuracies
For reasons of simplification, all months on the PowerPoint slide are of the same width. Thus, the tool uses a function to calculate the width of the task bars on basis of a year with 360 days. This leads to some cases of inaccurate task bars, but in general the visualization is close enough.
- Monthly time line
The time line of the PowerPoint Gantt is always in months, no matter which time structure you have in your mpp-file and no matter how long the total duration of your project might be.
- No easy way of changing general settings
The tool is reduced to the maximum. There is no such thing as general settings where you would be able to change colors, the height of the bars, the symbol for milestones, the number of rows per slide or anything else. All these settings are hard coded. If you are not happy with the look and feel of the slides, you have to change the VBA code. Changing colors is not too complicated. All you have to do is to adopt some of the constants in the VBA code. Adding additional columns, e.g. with the names of the resources or the duration of the tasks is a bit more complex.
How can you get it?
You can download it right here:
Download Export MPP to PPT (Project Standard 2003, zipped, 81.8K)
You need to have Microsoft PowerPoint and Microsoft Project installed and to enable macros when opening the file.
The tool is tested using Microsoft Project Standard 2003 and Microsoft PowerPoint 2003 and 2007.
Comments
60 responses to “Gantt Charts are learning to fly”
Hi,
a great utility …
but I’ve got a little problem. Trying to execute the macro, I get the following message: “Compile error: Can’t find project or library” related to the use of Format( intMonthNumber,”00″) in CreateSlideAndDrawSchedule procedure.
Thanks
Miguel,
Thanks for your comment.
I am sorry, I should have known this. You are using Project Standard 2007, right? There seems to be an issue with the standard VBA Format function when using Project 2007. I had a discussion with Gypsy1962 regarding this issue in the comments on bring your tasks in a row:
http://www.clearlyandsimply.com/clearly_and_simply/2009/01/bring-your-tasks-in-a-row.html
Actually the format function is not even necessary. I updated the download link now. Please download the file again and let me know if it is still not working.
Wow!
Excellent!. It works !
You’ve saved me tens of work hours for all the times I’ve to recreate the original plan in a PowerPoint.
Thanks a lot
Robert,
great job!
This post provides a tool to export a project plan from Microsoft Project.Great job.
Realy freaky cool!!!
Works with MS Project 2010 and PowerPoint 2007
I am getting an error
Runtime error “91”, and when I press debug it highlights the below…
“If (WhattoDraw <> 2) Or (varTask.OutlineLevel <= 2) Then" Thanks!
Viola,
thanks for your question.
I assume you are having empty rows in your project plan?
The code provided for download has no error handling for skipping empty rows. Thus, the code stops with a runtime error 91 as soon as it gets to the first empty row. Simply remove the empty rows from your project plan and the code should work fine.
How on earth does this work? I’ve tried dragging and dropping the module, but can’t get the macro windows on two Project files open at the same time!
Would be great if you have any advice!
Rob,
thanks for your comment.
I am not sure that I understand your problem correctly, but here are 2 ways of copying the code to your own file:
Option 1: Insert a module in your file, rename it and copy and paste the entire code from the module of the file provided for download above.
Option 2: Simply drag the module from my project to yours in the explorer window on the left of the VBE.
Please make sure that you also copy the code inside the object “ThisProject” to your file. The code inside this object creates and removes the menus when opening and closing the file.
If you are using Project 2007 or 2010, you probably have to save your project as a macro-enabled project first.
Close both files, open your file again, enable macros and you should be good to go.
If I misunderstood your question, please do not hesitate to come back.
We downloaded this and tried it with MPP 2010. The first scenario the shell with dummy data was opened and project info copied in and then saved. That works fine. The second scenario works in that the module can be copied into an existing project plan. After the file is saved and re-opened, the add-ins tab never displays. An Alt-F11 shows the basExportToPowerPoint module has been copied to the mpp file.
Any suggestions?
Rob,
Open a project file and minimize it. Then drag and drop the module on the minimized file icon at the bottom of your screen. You should be able to do it for multiple files.
Wildbiker,
thanks for your comments and for reading my blog. Unfortunately I do not understand the issue.
What do you mean by “the add-ins tab never displays” and “You should be able to do it for multiple files”?
Can you please elaborate a little bit on what your problem is?
Great job!
Works with MS Project 2010 and PowerPoint 2010
How does it work in MS Project Professional? I did not see any export to ppt on the menu when enabling macros.
sa,
if you are using version 2007 or later, the menu should be on the add-on tab.
If you copied the code to your own project file, make sure you also copied the code inside the object “ThisProject” to your file. The code inside this object creates and removes the menus when opening and closing the file. After you copied the code, save and close your file and open it again and you should see the menu.
Hi,
I want to add the column % complete but i am stuck in the VBA code. is it possible for you to give me an example how to add a column?
Thanks in advance.
By the way great work!!
Nkastelijn,
thanks for your comment.
Unfortunately your request is not as simple as it may sound. The VBA code is transferring the data of the Project file into PowerPoint text frames and texts and if you want to add a column, you have to make considerable changes in the VBA code. You need to diminish the width of the Gantt chart, reposition it and insert a percentage complete column (additional text frames) right to column with the task and milestone names.
It is easy to get the percentage complete data of a task in Project (property .PercentageComplete), but changing the whole structure of the output in PowerPoint requires changes in different parts of the VBA code. Way more than I am able to describe in a comment. I am sorry.
Robert,
Thanks for the answer. I was hoping you had time to place a file here with 2 columns (so add % complete or an other column) And i was hoping that more people had that wish… What i could imagine.
I hope i can figure it out by myself now.
Niki,
thanks for your reply.
I am receiving quite a number of requirements and change requests regarding most of the files I am posting for download here. Unfortunately I do not have the time to fulfill all wishes. I am sorry.
I am sure you will figure it out on your own.
Hi Robert,
I think i have a work around. Can i display the % complete instead of end date behind the bars and milestones?
How do i do that?
Kind regards,
Niki
Niki,
replace the line
.Text = DateFormat(varTask.Finish, pjDate_mm_dd_yy)
by this one:
.Text = Format(varTask.PercentComplete / 100, “0%”)
BRILLIANT Work my man ! Thanks a ton !
Hi!!
First of all thanks for this great tool! I have some issues: I don’t know why, everytime I export, it starts from 2nd month of 2013 instead of the first. Second, even if I choose 2 tasks that start and end in 2013, it always shows me 2014 and 2015..can I do something for this?
Thank you in advance!!
icezone,
the code is set up to always use the entire timeline of the project, i.e. the number of months between ActiveProject.ProjectStart and ActiveProject.ProjectFinish. It does not adjust the timeline to only show the months between the start and the end of the selected tasks.
If this is required, you will have to change the VBA code accordingly. The VBA project is open, i.e. there is no password. Feel free to change the code as you like.
oh ok, thank you. And what about the fact that ppt export starts from the 2nd month of 2013 instead of january?
Icezone,
I suspect your project starts in February 2013, so ActiveProject.ProjectStart is e.g. February 01, 2013 and as mentioned above the code takes this as the starting month of the timeline.
mmmh sorry Robert but my project started in half 2012 and ends in 2015..in fact, dates before february 2013 are shown on the “tasks and milestone” column, I think because it’s a too wide range of time. Can it be? Is there any fix to this?
Thank you
Icezone,
the code uses the start and end date of the project specified in the menu Project | Project Information, see also:
Specify a project start date or finish date
I suspect you have set the project start date as February 2013 there, but you have scheduled some tasks manually to start before this date. The tasks and milestones are shown in the PPT, but the timeline is too narrow, because it starts at the globally set specified project start date. Simply adjust the project start date and it should work.
You are right! Thank you 😀
Thank you for this awesome macro. I recently downloaded it and I do have a couple of questions.
1. Is there any way I could have the month “names” show instead of just a number?
2. If the Task name is longer than the one line, it doesn’t expand the box to show all wrapped text. Is there any way to have the box expand if there is more than one line of text or have the text shrink to fit?
Thank you,
Chris
Chris,
1. The month displayed in the header is assigned in this part of the code:
With objMonthHeader
With .TextFrame.TextRange
.Text = intMonthNumber
There is more than one way to skin the cat. For one, you could add a CASE statement here assigning the month name to .Text based on the month number.
2. The VBA code uses constants (cnstStepsWidth and cnstRowHeight) to define the width and height of the row header. It does not adjust automatically, but it wraps the text inside the textbox. You can change these constants to other values in order to make the header bigger, but you probably would also have to change other constants to make sure the Gantt Chart still fits on the slide.
Sorry for the late response Robert. Thank you for the information. I’ll have a look to see if I can implement the changes that I’m looking for.
Hi Robert,
Amazing work. I have changed the code a bit to suit my requirement and it works like a charm. The only thing that I have not figured out is how to insert a line across the slides to represent where we are today like the one we have in projects which shows a line across the gantt for todays date.
If you could give a guidance, it will be great.
Sumit
Sumit,
you have to calculate the position of today within your timeline and use the relevant constants in the VBA code to get the position of your vertical line.
Let’s say your timeline goes from January to December and today is the last day of September, i.e. 75% of the entire project is over. The horizontal position of your vertical “today line” is then calculated as follows:
cnstLeft + cnstStepsWidth + 75% * cnstTableWidth
Finally add a vertical line at this position with the desired length.
I hope this helps.
Thanks a lot!!!
Works very well.
you rock!!!
Hi,
Your code worked like a charm. Thank You !!!!
How can I add the % Work Complete and the Planned Work Complete to the bars in the powerpoint.
Appreciate any assistance.
Savy,
go to the VBE and search for the line
.Text = DateFormat(varTask.Finish, pjDate_mm_dd_yy)
It is line 484 in the code of the original project file posted above.
Add the following at the end of this line:
& ” ” & Format(varTask.PercentWorkComplete, “0%”) & ” ” & Format(varTask.PercentComplete, “0%”)
Robert,
Thank You for your quick response. On my project, we are tracking per duration instead of effort. I modified the syntax to:
.Text = DateFormat(varTask.Finish, pjDate_mm_dd) & ” ” & Format(varTask.Text1, “0%”) & ” ” & Format(varTask.PercentComplete / 100, “0%”)
Where Text1 is a calculated value to get Planned % Complete.
Can you please assist in
1. Adding a dynamic resizing code to adjust boxes as text increases.
2. To add RAG status in color within the invidiual bars with the % complete inside the bar.
It may be too much to ask. I am trying too but not sure how successful I can be.
🙂
Savy,
1: you can make the textboxes resize to the length of the text by setting these two properties of the textbox:
.TextFrame.WordWrap = False
.TextFrame.AutoSize = ppAutoSizeShapeToFitText
The latter is already set in the code, but the WordWrap line is missing.
2: to add the percentage complete inside of the bar, you can use the text of the bar shape (.TextFrame.TextRange.Text = […] and format and position it as you like. To color code it, you would add a Select Case statement (or an IF clause) and assign the relevant fill or font color based on the condition of the Case statement.
Thanks, Robert. Will give it a try.
Hi Robert,
This is a separate conversation but did not know how to reach out to you outside of this thread.
I have a macro that pulls data from Project to excel every Friday.
I am looking for a macro that can do the following for me.
I have multiple excel worksheets with the same set of rows where the % work complete and Planned % work complete changes every week.
I would like to collate this data per summary section from each worksheet into a master sheet and then use this to create trend charts.
Each summary task has a unique ID across all worksheets.
I have four common columns in all worksheets:
Track, Unique ID, Planned % Work Complete and Actual % Work Complete. In the Master sheet that I want to generate, I would like to have the Track and Unique ID and append the Planned % Work Complete and Actual % Work Complete columns for each week.
Thanks.
Savy,
consolidating data from several worksheets into a summary sheet by VBA is a very common Excel challenge and you can find hundreds of possible solutions available on the Internet.
Here are 2 examples to get you started:
MSDN – Consolidating Data from Multiple Worksheets into a Summary Worksheet
VBA Express – Combine all Worksheets into one
Hello Robert,
Hoping you are still reviewing this post. When I tried to use this code on my file, it only formats correctly if I use today’s data going forward. When I tired to use the date when the project started….3 months ago. The timeline bars go all the way over and cover the “Tasks and Milestones” information. Also, when I tried to use your file the timeline starts with 2008 no matter what dates I change the tasks to. Do you know what I could be doing wrong?
Thanks for any help you can provide.
Jason
Jason,
the code uses the defined start date of the project to draw the time line in PowerPoint. In Project, go to the Project tab on the ribbon, click on Project Information and change the Project Start Date to the date you want the time line to start with.
Perfect! Thanks Robert.
Hello Robert i went to add a vertical line in gantt chart it has to move according to date when i select the project date the vertical lines has to move.
can you help for vba coding.
karthik,
you have to adjust the left position of the vertical line according to the date where you want it to be.
If – for instance – the vertical line shall be at today, you would do a calculation like this:
(cnstTableWidth / _
((Month(datProjectFinish) – _
Month(datProjectStart) + 1) * 30)) * _
(Date – datProjectStart + 1)
Then add the offset constants which define the left of the Gantt chart and use the result as the left position of your vertical line.
Try GanttMagic, from the Microsoft Store. Works with any version of Project and PowerPoint
Hi Robert,
I am trying to use your code in MS Project 2013 version. It runs fine and generates the powerpoint but I am unable to access the code.
When I click on the Visual Basic icon under the Developer tab, no action occurs. When I click on the View Macros icon, it throws an error: “Unexpected error; quitting”
Would truly appreciate your assistance.
Thank You,
Savy
Actually, my bad. Did not check prior to posting my question. Visual Basic is not opening up even with out the code. Gives me an error: VBE6EXT.OLB could not be loaded. This is only happening in MS Project. I am able to open it in Excel.
Please let me know if you have come across this situation. I tried a few solutions that were posted my Microsoft but did not work.
Thanks,
Savy
Savy,
sounds like a corrupted file in your Office installation. Try to repair your Office installation (Control Panel) or – if this does not help – consider a re-installation of Microsoft Project.
I re-ran the MS Office suite and it fixed the issue.
Thank You,
Savy
Hi Robert,
Is there a way to convert the Month number to month text (3 letter abrv.) in the header.
Thank You for your assistance in advance,
Savy
Savy,
replace the line
.Text = intMonthNumber
by
.Text = MonthName(intMonthNumber, True)
Robert, you are the best!!!!
Thank You so much for your help.
-Savy
Hi Robert,
I’d need to import in a project file the resource calendar stored in an excel file in order to take into account the vacations for each resource.
Do you think it’s possible?
Luca,
sure, this is possible. If it is a one-time effort, you can transfer any data from Excel to Project by simply copying and pasting the data into the tables of Project.
If you need to do this on a regular basis, you would have to write some VBA code in Project, which asks the user for an Excel workbook to be imported and then automatically imports the data. I do not have a ready-to-use code snippet for this, but it shouldn’t be too complicated to write.