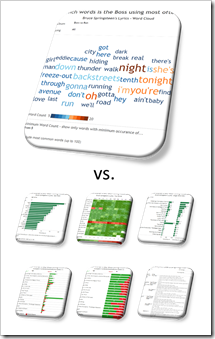
How to create Word Clouds with Tableau and a look at the value of Word Clouds for serious Business Data Analysis
 The previous two posts (Word Clouds with Microsoft Excel and The Implementation of Word Clouds with Excel) provided and explained my VBA-based solution to create dynamic Word Clouds (aka Tag Clouds) in Microsoft Excel.
Unlike Excel, Tableau provides a native feature to create Word Clouds with a few mouse clicks. The feature is available since Tableau version 8, but not everybody is aware of this, because Word Clouds aren’t displayed if you click the Show Me button (Tableau’s “chart gallery”).
That’s why I want to complete my short series on Word Clouds with a step-by-step description of how to create this type of view in Tableau and two tips to make Word Clouds more effective.
However, I am up to something more: Word Clouds are a nice little visualization and come in handy if you want to draw someone’s attention to your presentation or infographic. Having said that, they are more or less useless if you need your data to answer your questions or tell your story. The second part of today’s post will try to prove that there are much better visualizations for serious data analysis than a Word Cloud.
 The previous post
  Unlike