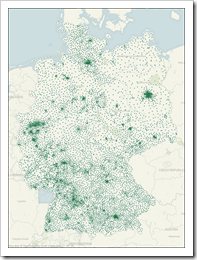
How to properly import a custom geocoding into Tableau for countries outside the US and the UK
 I am using Tableau for more than 3 years now and I am living in Germany. To my own surprise I noticed these days that I never used the Import Custom Geocoding feature of Tableau Software. Don’t ask me why. I always had the latitudes and longitudes in the underlying database, I guess.
A couple of days back, however, a colleague of mine asked for my assistance. He tried to make German postcodes available as a new geographic role in Tableau Software by using Custom Geocoding. He hit a roadblock: it simply didn’t work.
Thus, I had a look at this feature for the very first time and I faced the same problem: I couldn’t manage to properly import the data. More precisely: I couldn’t import the Custom Geocoding at all!
Even following a step-by-step tutorial described in the Tableau Knowledge Base (Importing Numeric Geographical Roles) led to the same issue: no import of the Custom Geocoding possible. Problems like this simply drive me nuts. After digging deeper into this, I finally found the root cause of the problem and a solution.
Today’s post describes how to properly import Custom Geocoding data in Tableau Software, if you are living outside of the US and the UK. The article is based on the example of German postcodes (“Postleitzahlen”, “PLZ2” and “PLZ5”), but the technique should be applicable to any other data set as well.
 Even if you are creating the most basic chart with