Tag: microsoft excel

  • Tooltips on Microsoft Excel Tables

    How to display Tooltips on Microsoft Excel Tables including additional information on the selected cell and aggregation results for the entire column
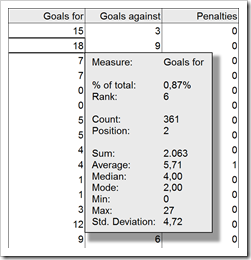
    Microsoft Excel Table TooltipsTooltips are a very helpful feature when exploring and investigating data. On charts and on plain data tables. When referring to tooltips, I am talking about additional details on the data currently selected or hovered over using the mouse. Tooltips could include other dimensions and measures, calculations or aggregated information like totals or averages.

    Tableau Software provides very powerful and easy to use tooltips. If you are working with Tableau, I once again recommend having a look at Andy Cotgreave’s great Tableau tooltip articles on the Data Studio (Tableau Tooltips: Conditional Formatting or Charts inside a tooltip? Yes, we can.). Thanks again for sharing, Andy.

    Compared to Tableau, Microsoft Excel’s tooltips functionality is next to nothing. We already had a post showing how to improve tooltips on Excel charts: Better Chart Tooltips with Microsoft Excel 2010.

    However, tooltips can be very helpful in plain data tables as well. Sure, Excel automatically displays some calculated aggregations of the selected range in the status bar. Yet, this is not enough. Your eyes always have to jump down to the status bar to see the information, the displayed quick calculations are limited and inflexible and you always have to select the range first. If you are working with larger data tables, you may wish for tooltips providing additional information on the selected value (like the percentage of total, the rank, etc.) and on aggregations across the entire column (like sum, average, etc.).

    Today’s post provides two slightly different approaches how to create better tooltips on Microsoft Excel tables. As usual including the Excel workbooks for free download.
    (more…)

  • An Underrated Chart Type: The Band Chart

    Why band charts should be used more often and how to create them with Microsoft Excel and Tableau Software

    Band Chart IntroBand chart, range chart, high-low line chart, corridor chart. I don’t know whether there is a standard term for this type of charts, so let me call it a band chart hereafter.
    What is a band chart?

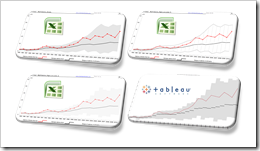
    Basically a band chart is a standard line chart enhanced with a shaded area displaying the upper and lower boundaries of groups of data (e.g. the range between the minimum and the maximum of all members of the category). Band charts are very often supplemented by another line showing the arithmetic mean (the average).

    What is the big whoop?

    Band charts provide by far more context to your visualization and more insight into your data. Especially if you have to explore unknown data sets. They are easy to implement, very intuitive, very effective and do not require one pixel more of your dashboard real estate than a standard single line chart.

    This being said, I have always been wondering why I do not see these charts more often in my professional environment. Are people underrating the benefits of band charts or am I overrating them?

    Today’s article discusses the benefits and the use cases of band charts and provides tutorials of how-to implement this type of chart with Microsoft Excel and Tableau Software. As ever, including the Excel workbooks for free download and the Tableau visualization for direct access via Tableau Public.

    (more…)

  • Range Filter Slider Control in Microsoft Excel

    How to use the Microsoft Slider Control to implement a range filter input feature in Microsoft Excel

    Intro Microsoft Slider ControlAlmost every Excel workbook needs some way of user interaction (maybe except for the Excel models serving solely as the reporting front-end of a database). The users changes parameters, sets filters, triggers actions and so forth.
    The most common way of user interaction in Excel is directly typing in values in a cell. Form controls like scrollbars, spin buttons, radio buttons, combo boxes, etc. are the next step of more convenient interactivity. ActiveX controls provide more flexibility than form controls, but they come with there own disadvantages and usually form controls are the way to go.

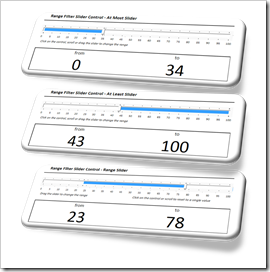
    However, there is one use case that cannot be covered with a standard Excel form control: selecting a range. Frequently required, especially for filtering data, e.g. a reporting period or products within a certain price range, etc.

    Sure, you can define 2 input cells, 2 spin buttons or 2 scrollbars to let the user select a range.Though, there is no standard Excel form control to select a range within one single control.

    However, Microsoft provides a less known ActiveX control to select a range. Today’s article describes a how-to tutorial on using the Microsoft Slider Control in Microsoft Excel workbooks. As always, including the Excel workbook for free download.

    (more…)

  • The Next Level of Interactive Microsoft Excel Dashboards

    A highly interactive Microsoft Excel Replica of Tableau’s Seattle Real Estate “Around the Sound” Dashboard

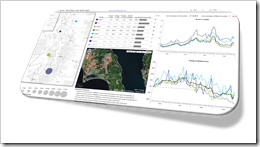
    Around the Sound Dashboard - IntroA couple of weeks ago I had the privilege to contribute to Chandoo's great Excel School. Chandoo and I discussed Excel dashboards in general and how to add interactive features. If you are subscribed to the dashboard module of Chandoo's Excel School, you will soon be able to watch the whole interview.

    Prior to our discussion, I prepared a simple interactive dashboard based on an example taken from the Tableau Software Visual Gallery: Around the Sound – Seattle Real Estate Prices. After our interview, I spent some more time with the model and enhanced this dashboard with more analytical features.

    We already had a post discussing interactivity on Excel dashboards: Bluffing Tableau Actions with Excel. However, the model I developed subsequent to my discussion with Chandoo includes more, hopefully helpful functionality. Thus, I thought you might be interested.

    Today’s post describes the enhanced model and provides the Excel workbook for free download. 

    (more…)

  • Excel Multiple Value Filters with Invert Selection

    How to enhance a multiple value filter check box control with an invert selection option in Microsoft Excel

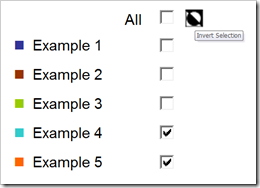
    Invert SelectionThe comments and emails I received on the recent post Excel Dashboard Controls – Multiple Value Filters reinforced my conclusion that the original idea of providing a feature to switch back to a previous selection is more confusing than helpful.
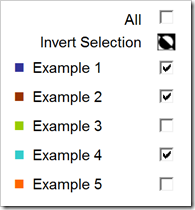
    However, there is another option to really improve the functionality of multiple value filters. Leonid, one of my few but faithful readers was kind enough to share a very interesting idea: add an additional input feature to let the user invert the actual selection.

    Leonid provided 2 different solutions. Number 1 is a simple inversion symbol with additional explanatory text. Clicking on the symbol inverts the actual selection of filters:

    Invert Selection V01

    The VBA code triggered when clicking on the symbol is straight forward:

    Sub InvertFilters()
    Dim rng_cell As Range
        For Each rng_cell In Range("myActualFilter")
            rng_cell.Value = Not rng_cell.Value
        Next rng_cell
        Range("myCheckBoxAll").Value = _
                 Application.WorksheetFunction.And(Range("myActualFilter").Value)
    End Sub

    The code simply inverts all target values of the check boxes from TRUE to FALSE and vice versa.

    Here is the workbook for free download:

    Download Multiple Value Filter Control with Invert Selection v01 (Microsoft Excel 2003, 91K)

    If the additional row bothers you, you may want to look at Leonid’s alternative option: use a hyperlink on the symbol to provide a tooltip (”Invert Selection”):

    Invert Selection V02

    There is an additional cell and some more code necessary (on the dashboard worksheet), but the implementation is still pretty straight forward. Here is the workbook:

    Download Multiple Value Filter Control with Invert Selection v02 (Microsoft Excel 2003, 96K)

    Leonid, many thanks for sharing your ideas here and for your workbooks. Your contributions are highly appreciated.