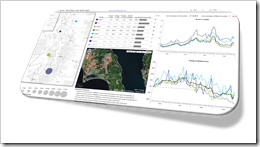
A highly interactive Microsoft Excel Replica of Tableau’s Seattle Real Estate “Around the Sound” Dashboard
 A couple of weeks ago I had the privilege to contribute to Chandoo's great Excel School. Chandoo and I discussed Excel dashboards in general and how to add interactive features. If you are subscribed to the dashboard module of Chandoo's Excel School, you will soon be able to watch the whole interview.
Prior to our discussion, I prepared a simple interactive dashboard based on an example taken from the Tableau Software Visual Gallery: Around the Sound – Seattle Real Estate Prices. After our interview, I spent some more time with the model and enhanced this dashboard with more analytical features.
We already had a post discussing interactivity on Excel dashboards: Bluffing Tableau Actions with Excel. However, the model I developed subsequent to my discussion with Chandoo includes more, hopefully helpful functionality. Thus, I thought you might be interested.
Today’s post describes the enhanced model and provides the Excel workbook for free download.