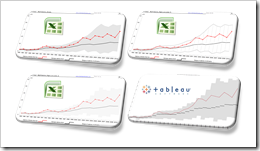
Why band charts should be used more often and how to create them with Microsoft Excel and Tableau Software
 Band chart, range chart, high-low line chart, corridor chart. I don’t know whether there is a standard term for this type of charts, so let me call it a band chart hereafter.
What is a band chart?
Basically a band chart is a standard line chart enhanced with a shaded area displaying the upper and lower boundaries of groups of data (e.g. the range between the minimum and the maximum of all members of the category). Band charts are very often supplemented by another line showing the arithmetic mean (the average).
What is the big whoop?
Band charts provide by far more context to your visualization and more insight into your data. Especially if you have to explore unknown data sets. They are easy to implement, very intuitive, very effective and do not require one pixel more of your dashboard real estate than a standard single line chart.
This being said, I have always been wondering why I do not see these charts more often in my professional environment. Are people underrating the benefits of band charts or am I overrating them?
Today’s article discusses the benefits and the use cases of band charts and provides tutorials of how-to implement this type of chart with Microsoft Excel and Tableau Software. As ever, including the Excel workbooks for free download and the Tableau visualization for direct access via Tableau Public.