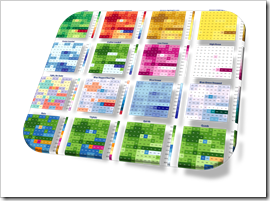
How to create Heat Maps in Microsoft Excel using individual Color Scales to support the analytical insights into the distribution of the data
 In his brilliant guest post Analytical Color Scales for Heat Maps, Ron Whale explained, how color scales can efficiently support the process of analyzing data.
Applying different, thoroughly designed color schemes can help to gain deeper insights into the distribution of data, to identify outliers, to focus on special points of interest, to find similar groupings and more.
In a nutshell: switching between color scales of a Choropleth or Heat Map helps you to understand your data.
Whilst Ron was developing his great palette of color schemes for using them on a Choropleth Map, they are equally helpful for a much simpler visualization technique: a Heat Map of a table (or range) of numbers.
Microsoft Excel does provide a built-in feature to create a Heat Map on a range of numbers: Conditional Formatting. However, this is limited regarding the configuration of the color scales and it does not provide the option to easily switch between color schemes for supporting the data analysis process.
Today’s post provides a technique to overcome this shortcoming of Excel: a VBA-based solution to easily apply any given color scale to an Excel range with only two mouse clicks. As always, the post comes with the workbook for free download.